Bow-tie diagram
A bow-tie diagram is a type of diagram used to model and visualize risk management and preparedness. The diagram visualizes an event with it's perceived threats, consequences, damage mitigation measures and preventive measures.[1]
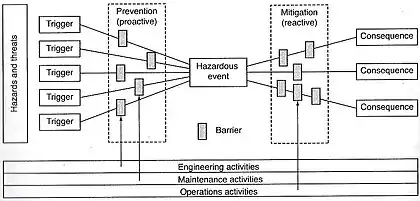
Bow-tie diagrams, often called bow-ties or bowties, have been successful in assisting industries such as in engineering, oil and gas, aviation, industrials, and finance.[2][3]
History
The origins of bow-tie is believed to have originate from Imperial Chemical Industries in the 1970's. However, Royal Dutch Shell is considered to be the first major company to successfully integrate bow-ties into their business practices.[3]
Overview

Bow-ties are usually found in one of the last phases of the risk management process, after the assessment of risk. Where specific events are focused and placed in the middle of the diagram. Threats and preventive measures are placed in the left part of the diagram, as part of the preventive controls for potential causes. Consequences and damage mitigation measures are placed on the right side, as part of the potential impact and corresponding plan for recovery preparedness.[4][5]
Bow-ties are sometimes simplified to exclude any barriers, only to illustrate a left- and right side without preventive measures and damage mitigation measures.
Some of the practical uses of a bow-tie diagram, in addition to risk management and preparedness, is communication, auditing, understanding specific risks, and formal demonstration.[3]
Use in various disciplines
Bow-ties have been used in a set of various disciplines, which for example includes:
- Network theory with network theory in risk assessment
- Information security with cyber security risks[6]
- Preventing accidents and losses in aerospace projects[7]
References
- Fogler, Professor H. Scott. "Process Safety Across the Chemical Engineering Curriculum". University of Michigan.
- "Introduction to bowtie | UK Civil Aviation Authority". www.caa.co.uk. Retrieved 2021-09-20.
- Sneddon, James. "Practical Application of Bowtie Analysis" (PDF). Chemical Institute of Canada.
- Groot, Daphne de. "BowTieXP - Bowtie Software". CGE Risk. Retrieved 2021-09-20.
- "Bowtie Analysis and Barrier-Based Risk Management". ISPE | International Society for Pharmaceutical Engineering. Retrieved 2021-09-20.
- Bernsmed, Karin (2018). "Visualizing Cyber Security Risks with Bow-Tie Diagrams" (PDF). SINTEF.
- Leveson, Prof. Nancy G. "Shortcomings of the Bow Tie and Other Safety Tools Based on Linear Causality" (PDF). Massachusetts Institute of Technology.