Kentucky's 5th congressional district
Kentucky's 5th congressional district is a congressional district in the U.S. state of Kentucky. Located in the heart of Appalachia in Southeastern Kentucky, the rural district is the second most impoverished district in the nation[5] and, as of the 2010 U.S. Census, has the highest percentage of White Americans in the nation. Within the district are the economic leading cities of Pikeville, Prestonsburg, Middlesboro, Hazard, Jackson, Morehead, London, and Somerset. It is the most rural district in the United States, with 76.49% of its population in rural areas.[6]
| Kentucky's 5th congressional district | |||
|---|---|---|---|
.tif.png.webp) Kentucky's 5th congressional district - since January 3, 2013. | |||
| Representative |
| ||
| Distribution |
| ||
| Population (2019) | 689,793[2] | ||
| Median household income | $35,636[3] | ||
| Ethnicity |
| ||
| Cook PVI | R+33[4] | ||
With a Cook Partisan Voting Index rating of R+33, it is the most Republican district in Kentucky and tied with Texas's 13th as the second most Republican district in the country.[4] The 5th congressional district is one of the few ancestrally Republican regions south of the Ohio River. Much of the region now in the district strongly supported the Union in the Civil War, and identified with the Republicans after hostilities ceased. By contrast, the northeastern portion of the district borders West Virginia. Much of this section of the district was once part of the disbanded 7th congressional district, long a Democratic stronghold. The 7th was disbanded in 1992 after the 1990 census showed that the state's population no longer merited seven districts. Geographically, the district consists of flat land areas to the west, to Appalachia highland mountains to the east and southeast. To the north and northeast of the district are rolling hills that end at the Ohio River.
Despite the district's strong Republican lean, it features the county of Elliott, which, before being carried by Donald Trump in 2016, had never voted for a Republican president since its founding in 1869, making it the longest Democratic voting streak. The county had not voted for the district's current representative, Hal Rogers, who except for 1992 has always been elected by at least 65%, before 2018, when he received 54.6% of the county's vote.
The district is represented by Republican Harold D. "Hal" Rogers, the dean of the Kentucky delegation. Rogers serves in various leadership positions in the U.S. House of Representatives.
Characteristics
As of August 2021, there were 539,116 registered voters: 292,018 Republicans, 215,576 Democrats, 16,855 unclassified Others, 13,047 Independents, 1,292 Libertarians, 151 Greens, 104 Constitutionalists, 14 Reforms, and 29 Socialist Workers.[7]
Until January 1, 2006, Kentucky did not track party affiliation for registered voters who were neither Democratic nor Republican.[8] The Kentucky voter registration card does not explicitly list anything other than Democratic Party, Republican Party, or Other, with the "Other" option having a blank line and no instructions on how to register as something else.[9]
Recent presidential elections
| Election results from presidential races | ||
|---|---|---|
| Year | Office | Results |
| 2000 | President | Bush 57 - 42% |
| 2004 | President | Bush 61 - 39% |
| 2008 | President | McCain 67 - 31% |
| 2012 | President | Romney 75 - 23% |
| 2016 | President | Trump 80 - 18% |
| 2019 | Governor | Bevin 60.6 - 37.1% |
| 2020 | President | Trump 80 - 19% |
List of members representing the district
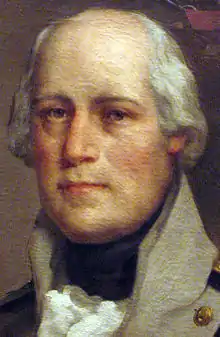
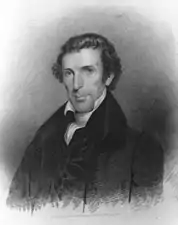
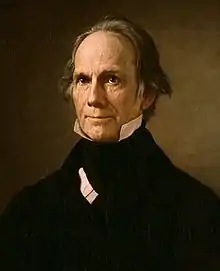
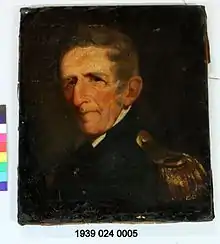
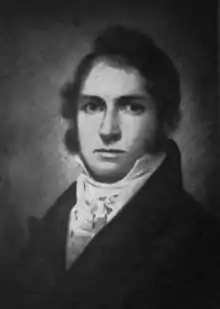
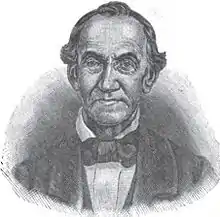
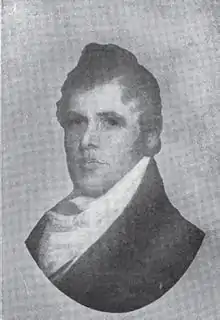
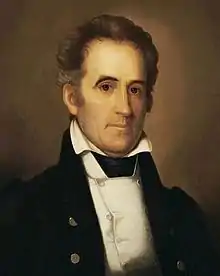
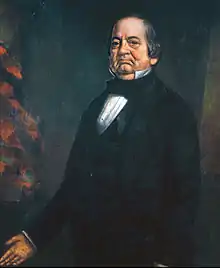
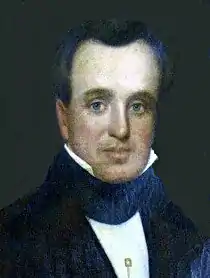
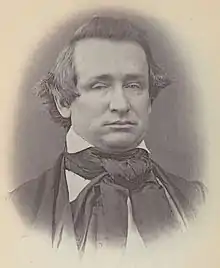
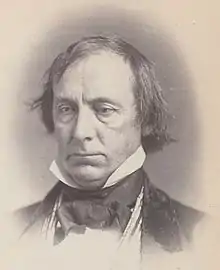
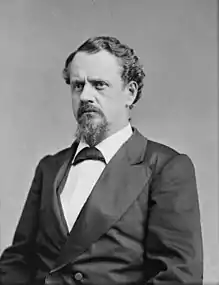
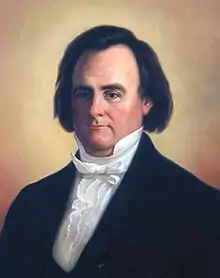
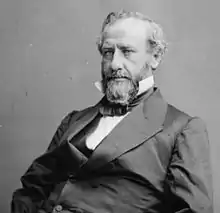
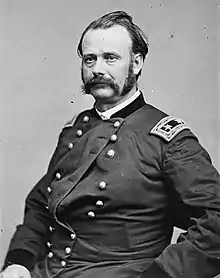
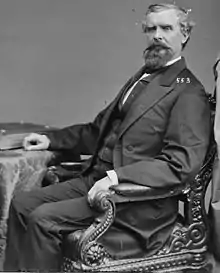
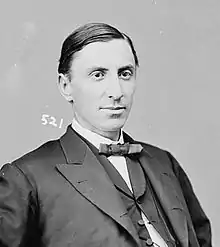
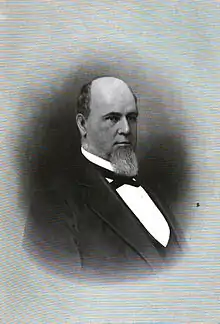
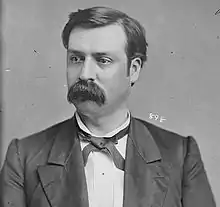
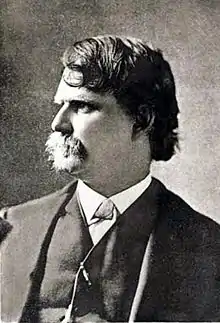
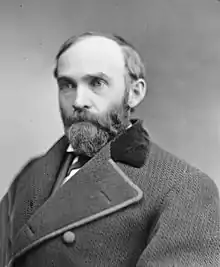
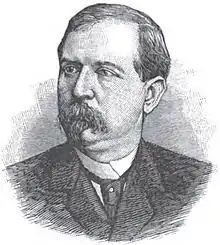
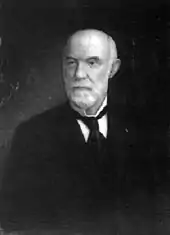
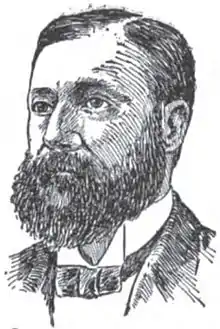
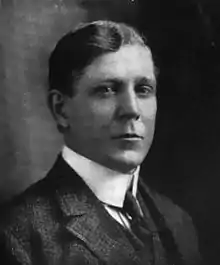
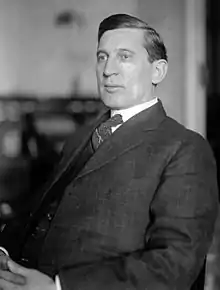

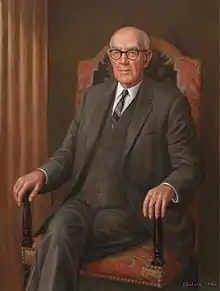
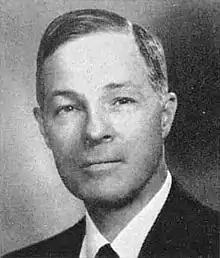
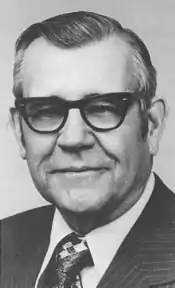


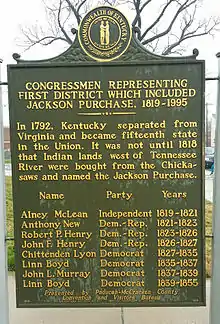
.tif.png.webp)
Recent election results
2002
| Party | Candidate | Votes | % | |
|---|---|---|---|---|
| Republican | Hal Rogers* | 137,986 | 78.29 | |
| Democratic | Sidney Jane Bailey | 38,254 | 21.71 | |
| Total votes | 176,240 | 100.00 | ||
| Turnout | ||||
| Republican hold | ||||
2004
| Party | Candidate | Votes | % | |
|---|---|---|---|---|
| Republican | Hal Rogers* | 177,579 | 100.00 | |
| Total votes | 177,579 | 100.00 | ||
| Turnout | ||||
| Republican hold | ||||
2006
| Party | Candidate | Votes | % | |
|---|---|---|---|---|
| Republican | Hal Rogers* | 147,261 | 73.76 | |
| Democratic | Kenneth Stepp | 52,384 | 26.24 | |
| Total votes | 199,645 | 100.00 | ||
| Turnout | ||||
| Republican hold | ||||
2008
| Party | Candidate | Votes | % | |
|---|---|---|---|---|
| Republican | Hal Rogers* | 177,024 | 84.11 | |
| Independent | Jim Holbert | 33,444 | 15.89 | |
| Total votes | 210,468 | 100.00 | ||
| Turnout | ||||
| Republican hold | ||||
2010
| Party | Candidate | Votes | % | |
|---|---|---|---|---|
| Republican | Hal Rogers* | 151,019 | 77.43 | |
| Democratic | Jim Holbert | 44,034 | 22.58 | |
| Total votes | 195,053 | 100.00 | ||
| Turnout | ||||
| Republican hold | ||||
2012
| Party | Candidate | Votes | % | |
|---|---|---|---|---|
| Republican | Hal Rogers* | 195,408 | 77.90 | |
| Democratic | Kenneth S. Stepp | 55,447 | 22.10 | |
| Total votes | 250,855 | 100.00 | ||
| Turnout | ||||
| Republican hold | ||||
2014
| Party | Candidate | Votes | % | |
|---|---|---|---|---|
| Republican | Hal Rogers* | 171,350 | 78.30 | |
| Democratic | Kenneth S. Stepp | 47,617 | 21.70 | |
| Total votes | 218,967 | 100.00 | ||
| Turnout | ||||
| Republican hold | ||||
2016
| Party | Candidate | Votes | % | |
|---|---|---|---|---|
| Republican | Hal Rogers* | 221,242 | 100.00 | |
| Total votes | 221,242 | 100.00 | ||
| Turnout | ||||
| Republican hold | ||||
2018
| Party | Candidate | Votes | % | |
|---|---|---|---|---|
| Republican | Hal Rogers* | 172,093 | 78.9 | |
| Democratic | Kenneth Stepp | 45,890 | 21.0 | |
| Independent | Bill Ray (write-in) | 34 | 0.1 | |
| Total votes | 218,017 | 100.0 | ||
| Republican hold | ||||
2020
| Party | Candidate | Votes | % | |
|---|---|---|---|---|
| Republican | Hal Rogers* | 250,660 | 84.2 | |
| Democratic | Matthew Best | 46,993 | 15.8 | |
| Total votes | 297,653 | 100.0 | ||
| Republican hold | ||||
References
- Geography, US Census Bureau. "Congressional Districts Relationship Files (state-based)". www.census.gov. Archived from the original on July 17, 2017. Retrieved April 9, 2018.
- Bureau, Center for New Media & Promotion (CNMP), US Census. "My Congressional District". www.census.gov. Retrieved April 9, 2018.
- Center for New Media & Promotion (CNMP), US Census Bureau. "My Congressional District". www.census.gov.
- "Introducing the 2021 Cook Political Report Partisan Voter Index". The Cook Political Report. April 15, 2021. Retrieved April 15, 2021.
- "Rich, poor, young, old: Congressional districts at a glance".
- "Congressional Districts – 113th Congress Demographics – Urban Rural Patterns". proximityone.com. Retrieved November 12, 2020.
- "Registration Statistics". Kentucky State Board of Elections. August 2021.
- "Kentucky Administrative Regulations 31KAR4:150". Kentucky Legislative Research Commission. November 2005. Retrieved February 6, 2014.
- "Register To Vote". Kentucky State Board of Elections. August 2003. Retrieved February 6, 2014.
- Martis, Kenneth C. (1989). The Historical Atlas of Political Parties in the United States Congress. New York: Macmillan Publishing Company.
- Martis, Kenneth C. (1982). The Historical Atlas of United States Congressional Districts. New York: Macmillan Publishing Company.
- Congressional Biographical Directory of the United States 1774–present