Minnesota's 8th congressional district
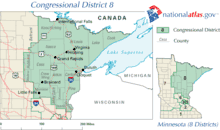
Minnesota's 8th congressional district covers the northeastern part of Minnesota. It is anchored by Duluth, the state's fourth-largest city. It also includes most of the Mesabi & Vermilion iron ranges, and the Boundary Waters Canoe Area in the Superior National Forest. The district is best known for its mining, agriculture, tourism, and shipping industries.
| Minnesota's 8th congressional district | |||
|---|---|---|---|
.tif.png.webp) Minnesota's 8th congressional district - since January 3, 2013. | |||
| Representative |
| ||
| Area | 27,583[1] sq mi (71,440 km2) | ||
| Distribution |
| ||
| Population (2019) | 671,346[3] | ||
| Median household income | $61,659[3] | ||
| Ethnicity |
| ||
| Cook PVI | R+10[4] | ||
| External image | |
|---|---|
 THIS govtrack.us MAP, is a useful representation of the 8th CD's borders, based on Google Maps. THIS govtrack.us MAP, is a useful representation of the 8th CD's borders, based on Google Maps. |
For many decades, the district reliably voted Democratic, but in 2016, Republicans made strong gains and Donald Trump carried the district by a 15-point margin. In the 2018 midterm election, it was one of only three congressional districts in the country which flipped to Republican. The eastern part of the district (Carlton, Cook, Lake, and St. Louis counties) tends to vote Democratic while the rest of the district leans Republican.[5]
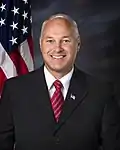
The district is represented by Republican Pete Stauber.[5][6]
The district is notable for being the last one assigned after both the 2010 and 2020 censuses. After the 2020 census in particular, in spite of early predictions that it would be eliminated, Minnesota held onto the district by a mere 89 people, beating out New York's 27th district for the last spot.[7]
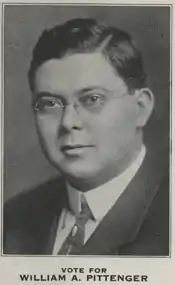
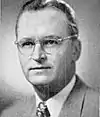
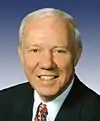
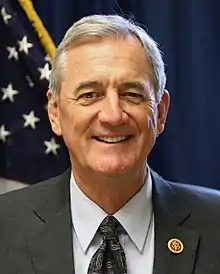
List of members representing the district
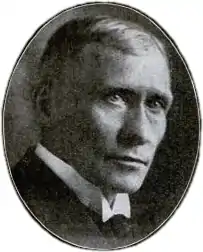
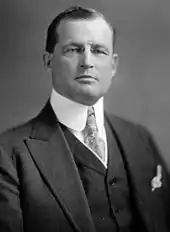
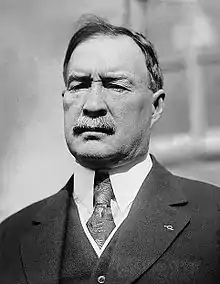
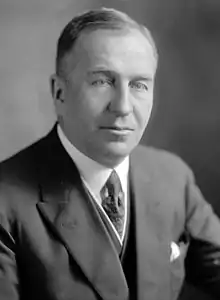


Recent elections
| Year | Nominee | Party | Votes | % | Nominee | Party | Votes | % | Nominee | Party | Votes | % |
|---|---|---|---|---|---|---|---|---|---|---|---|---|
| 2002 | Jim Oberstar | Democratic | 193,959 | 68.6 | Bob Lemen | Republican | 88,423 | 31.2 | ||||
| 2004 | Jim Oberstar | Democratic | 228,509 | 65.2 | Mark Groettum | Republican | 112,657 | 32.2 | Van Presley | Green | 8,933 | 2.5 |
| 2006 | Jim Oberstar | Democratic | 194,677 | 63.6 | Rod Grams | Republican | 101,744 | 34.4 | Harry Welty | Unity | 5,508 | 1.9 |
| 2008 | Jim Oberstar | Democratic | 240,586 | 67.6 | Michael Cummins | Republican | 114,588 | 32.2 | ||||
| 2010 | Jim Oberstar | Democratic | 129,072 | 46.6 | Chip Cravaack | Republican | 133,479 | 48.2 | Timothy Olson | Independence | 11,876 | 4.3 |
| 2012 | Rick Nolan | Democratic | 192,748 | 54.5 | Chip Cravaack | Republican | 161,113 | 45.5 | ||||
| 2014 | Rick Nolan | Democratic | 129,089 | 48.5 | Stewart Mills III | Republican | 125,357 | 47.1 | Ray Sandman | Green | 11,450 | 4.3 |
| 2016 | Rick Nolan | Democratic | 178,893 | 50.2 | Stewart Mills III | Republican | 176,821 | 49.6 | ||||
| 2018 | Joe Radinovich | Democratic | 141,972 | 45.2 | Pete Stauber | Republican | 159,388 | 50.7 | Ray Sandman | Independence | 12,741 | 4.1 |
| 2020 | Quinn Nystrom | Democratic | 147,853 | 37.6 | Pete Stauber | Republican | 223,432 | 56.7 | Judith Schwartzbacker | Grassroots | 22,190 | 5.6 |
Election results from statewide races
| Year | Office | Results |
|---|---|---|
| 2000 | President | Al Gore 49 - George W. Bush 43% |
| 2004 | President | John Kerry 53 - George W. Bush 46% |
| 2008 | President | Barack Obama 53 - John McCain 45% |
| Senate | Al Franken 52.3 - Norm Coleman 47.6% | |
| 2012 | President | Barack Obama 51.7 - Mitt Romney 46.2% |
| Senate | Amy Klobuchar 65 - Kurt Bills 31% | |
| 2014 | Senate | Al Franken 54 - Mike McFadden 42% |
| 2016 | President | Donald Trump 54.2 - Hillary Clinton 38.6% |
| 2018 | Senate | Amy Klobuchar 53.7 - Jim Newberger 42.9% |
| Senate (special) | Karin Housley 48.3 - Tina Smith 46.8% | |
| Governor | Jeff Johnson 48.9 - Tim Walz 47.1% | |
| 2020 | President | Donald Trump 56.3 - Joe Biden 41.7% |
Historical district boundaries
References
- "Minnesota congressional districts by urban and rural population and land area" (PDF). US Census Bureau. 2000. Retrieved April 2, 2007.
- Geography, US Census Bureau. "Congressional Districts Relationship Files (state-based)". www.census.gov.
- "My Congressional District". www.census.gov. US Census Bureau Center for New Media & Promotion (CNMP).
- "Introducing the 2021 Cook Political Report Partisan Voter Index". The Cook Political Report. April 15, 2021. Retrieved April 15, 2021.
- "Minnesota Election Results 2018: Live Midterm Map by County & Analysis". Retrieved November 7, 2018.
- "Minnesota's 8th Congressional District election, 2016 - Ballotpedia". Retrieved November 14, 2016.
- "Minnesota avoids losing House seat to New York by 89 people". The Ridgefield Press. April 26, 2021. Retrieved April 26, 2021.