Trends in International Mathematics and Science Study
The IEA's Trends in International Mathematics and Science Study (TIMSS) is a series of international assessments of the mathematics and science knowledge of students around the world. The participating students come from a diverse set of educational systems (countries or regional jurisdictions of countries) in terms of economic development, geographical location, and population size. In each of the participating educational systems, a minimum of 4,000 to 5,000 students is evaluated. Contextual data about the conditions in which participating students learn mathematics and science are collected from the students and their teachers, their principals, and their parents via questionnaires.[1]


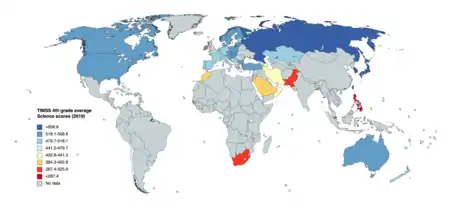
TIMSS is one of the studies established by IEA aimed at allowing educational systems worldwide to compare students' educational achievement and learn from the experiences of others in designing effective education policy. This assessment was first conducted in 1995, and has been administered every four years thereafter. Therefore, some of the participating educational systems have trend data across assessments from 1995 to 2019.[2] TIMSS assesses 4th and 8th grade students, while TIMSS Advanced assesses students in the final year of secondary school in advanced mathematics and physics.
Definition of Terms
"Eighth grade" in the United States is approximately 13–14 years of age and equivalent to:
- 3rd Form in England, Northern Ireland and Wales
- 2nd Year in the Republic of Ireland
- 2nd Year in Scotland
- 1st Year in South Africa
- Form 2 in Hong Kong
- Third Year in France
- Year 9 in New Zealand
- Form 2 in Malaysia
"Fourth grade" in the United States is approximately equivalent to 9–10 years of age and equivalent to:
- Primary 6 (P6) in the United Kingdom
- Group 6 in the Netherlands
- CM1 in France
- Fourth Class in the Republic of Ireland
- Standard 3 or Year 5 in New Zealand
History
A precursor to TIMSS was the First International Mathematics Study (FIMS) performed in 1964 in 11 countries for students aged 13 and in the final year of secondary education (FS) under the auspices of the International Association for the Evaluation of Educational Achievement (IEA). This was followed in 1970-71 by the First International Science Study (FISS) for students aged 10, 14, and FS. Fourteen countries tested 10-year-olds; 16 countries tested the older two groups. These were replicated between 1980 and 1984.[3]
These early studies were revised and combined by the IEA to create TIMSS, which was first administered in 1995. It was the largest international student assessment study of its time and evaluated students in five grades. In the second cycle (1999) only eighth-grade students were tested. In the next cycles (2003, 2007, 2011 and 2015) both 4th and 8th grade students were assessed. The 2011 cycle was performed in the same year as the IEA's Progress in International Reading Literacy Study (PIRLS), offering a comprehensive assessment of mathematics, science and reading for the countries participating in both studies. The sixth cycle was conducted in 2015, and the results were released in 2016;[4] the data set was published in February 2017. TIMSS 2015 included data collected from parents for the first time.[5] TIMSS Advanced, previously conducted in 1995 and 2008, was also conducted in 2015, and assessed final-year secondary students' achievement in advanced mathematics and physics. Policy-relevant data about curriculum emphasis, technology use, and teacher preparation and training accompanies the TIMSS Advanced results.
The seventh cycle of TIMSS was conducted in 2019 and marked the beginning of the transition to a digital assessment format, with the digital assessment administered to half of participating countries, and the paper assessment administered to the remaining half. 64 countries and 8 benchmarking systems participating in TIMSS 2019. Results were released in December 2020. [6]
Preparations are underway for TIMSS 2023.
Method, data and documentation
Along with the overall students’ achievement data, TIMSS comprehensive assessments include data on student performance in various mathematics and science domains (algebra, geometry, biology, chemistry, etc.) and on performance in the problem solving challenges in each of these contexts. In addition, TIMSS provides contextual data on crucial curricular, instructional, and resource-related factors that can impact the teaching and learning process. These data are gathered using student, teacher, school, and curriculum (national) questionnaires filled out by students, teachers, school principals and National Research Coordinators, respectively.
According to the TIMSS 2019 Assessment Frameworks, “The TIMSS mathematics and science achievement scales were created with the first TIMSS assessment in 1995, separately for each subject and each grade. The scale units were established so that 100 points on the scale was equivalent to one standard deviation of the distribution of achievement across all of the countries that participated in TIMSS 1995, and the scale midpoint of 500 was located at the mean of this international achievement distribution. The TIMSS achievement scales were first used for reporting TIMSS results with TIMSS 1995, and all results from subsequent TIMSS assessments have been reported on the same scale metrics, making it possible to measure growth or decline in countries’ achievement distributions from assessment to assessment.”[7]
Because TIMSS is administered in four-year cycles, it enables participating counties to use the results between the fourth and eighth grades to track the changes in achievement and certain background factors from an earlier study. For example, results of the fourth grade in TIMSS 1995 can be compared with the results of the eighth grade in TIMSS 1999, as fourth graders had become eighth graders in the next cycle of study.[8]
The collected information is presented in different formats. For example, for TIMSS 2019 the results are presented as TIMSS 2019 International Results in Mathematics and Science TIMSS 2019 International Results in Mathematics and Science. The TIMSS 2019 Encyclopedia provides an overview of how mathematics and science are taught in each participating country. Methods and Procedures: TIMSS 2019 Technical Report documents the development of the TIMSS assessments and questionnaires, and describes the methods used. The TIMSS 2019 User Guide for the International Database describes the content and format of the data in the TIMSS 2019 International Database.
The IEA has developed an application for working with data from TIMSS and other IEA large-scale assessments called the "IEA International Database (IDB) Analyzer".. This application allows researchers to combine data files and facilitates some types of statistical analysis (such as computing means, percentages, percentiles, correlations, and estimating single level multiple linear regression). The application takes into account the complex sample structure of the databases when calculating the statistics and their standard errors. It also allows researchers to estimate achievement scores and their standard errors.
For an overview of the IEA study results and interpretation of information, the IEA's "Data Visualizer". can come in handy.
Cycles
TIMSS 2019
TIMSS 2019 was the seventh cycle of TIMSS and reported overall achievement as well as results according to international benchmarks, by major content domains (number, algebra, and geometry in mathematics, and earth science, biology, and chemistry in science) and by cognitive domains (knowing, applying, reasoning).[9] TIMSS 2019 collected detailed information about curriculum and curriculum implementation of participating countries and published this information the TIMSS 2019 Encyclopedia: Education Policy and Curriculum in Mathematics and Science.[10]
TIMSS 2019 marked the transition to a digital assessment format, allowing for new and innovative item types. In the digital assessment, students solved problems by interacting with shapes and patterns, arranging items on the screen, dragging and dropping items, and drawing. The digital version of TIMSS 2019 also introduced Problem Solving and Inquiry tasks that simulated real-world and laboratory situations and called for students to integrate and apply process skills and content knowledge. Half of the participating countries took the paper version of TIMSS and half of the participating countries took the digital version of TIMSS.
TIMSS 2019 results are summarized in TIMSS 2019 International Results in Mathematics and Science.[6] This detailed report presents achievement and contextual data from participating countries and benchmarking entities. The TIMSS 2019 Encyclopedia: Education Policy and Curriculum in Mathematics and Science describes various features of the education systems in each participating country, including the mathematics and science curriculum, professional development requirements for teachers, and methods of monitoring student progress in mathematics and science. Each country's "chapter" in the encyclopedia was authored by that country's TIMSS representative.[11]
TIMSS 2015
In TIMSS 2015,[12] nationally representative samples of students in 57 countries and 7 benchmarking entities participated in the fourth grade assessment, the eighth grade assessment, or both.[13]
TIMSS 2011
TIMSS 2011[14] had 52 participating educational systems for the fourth grade and 45 for the eighth grade.[5]
TIMSS 2007
In TIMSS 2007,[15] 43 educational systems participated in the fourth grade and 56 educational systems in the eighth grade.
Eighth grade
|
| ||||||||||||||||||||||||||||||||||||||||||||||||||||||||||||||||||||||||||||||||||||||||||||||||||||||||||||||||||||||||||||||||||||||||||||||||||||||||||||||||||||||||||||||||||||||||||||||||||||||||||||||||||||||||||||||||||||||||||||||||||||||||||||||||||||||||||||||||||||||||||||||||||||||||||||||||||||||||||||||||||||||||||||||||||||||||||||||||||||||||||||||||||||||||||||||||||||||||||||||||||||||||||||||||||||||||||||||||||||||||||||||||||||||||||||||||||||||||||||||||













.svg.png.webp)






























Fourth grade
|
| ||||||||||||||||||||||||||||||||||||||||||||||||||||||||||||||||||||||||||||||||||||||||||||||||||||||||||||||||||||||||||||||||||||||||||||||||||||||||||||||||||||||||||||||||||||||||||||||||||||||||||||||||||||||||||||||||||||||||||||||||||||||||||||||||||||||||||||||||||||||||||||||||||||||||||||||||||||||||||||||||||||||||||||||||||||||||||||||||||||||||||||||||||||||||









TIMSS 2003
In TIMSS 2003,[18] there were 26 educational systems for the fourth grade and 48 for the eighth grade.[19]
Eighth grade
|
| ||||||||||||||||||||||||||||||||||||||||||||||||||||||||||||||||||||||||||||||||||||||||||||||||||||||||||||||||||||||||||||||||||||||||||||||||||||||||||||||||||||||||||||||||||||||||||||||||||||||||||||||||||||||||||||||||||||||||||||||||||||||||||||||||||||||||||||||||||||||||||||||||||||||||||||||||||||||||||||||||||||||||||||||||||||||||||||||||||||||||||||||||||||||||||||||||||||||||||||||||||||||||||||||||||||||||||||||||||||||||
.svg.png.webp)







- 9th grade students
Fourth grade
|
| ||||||||||||||||||||||||||||||||||||||||||||||||||||||||||||||||||||||||||||||||||||||||||||||||||||||||||||||||||||||||||||||||||||||||||||||||||||||||||||||||||||||||||||||||||||||||||||||||||||||||||||||||||||||||||||||||||||||||||||||||||||||||||||||||
TIMSS 1999
In 1999,[22] TIMSS only focused on the eighth grade in 38 educational systems; there was no study done for the fourth grade in that year.[23]
Eighth grade
|
| ||||||||||||||||||||||||||||||||||||||||||||||||||||||||||||||||||||||||||||||||||||||||||||||||||||||||||||||||||||||||||||||||||||||||||||||||||||||||||||||||||||||||||||||||||||||||||||||||||||||||||||||||||||||||||||||||||||||||||||||||||||||||||||||||||||||||||||||||||||||||||||||||||||||||||||||||||||||||||||||||||||||||
.svg.png.webp)

TIMSS 1995
In TIMSS 1995,[26] there were 41 educational systems in five grades (third, fourth, seventh, eighth, and the final year of secondary school).[5]
Eighth grade
|
| ||||||||||||||||||||||||||||||||||||||||||||||||||||||||||||||||||||||||||||||||||||||||||||||||||||||||||||||||||||||||||||||||||||||||||||||||||||||||||||||||||||||||||||||||||||||||||||||||||||||||||||||||||||||||||||||||||||||||||||||||||||||||||||||||||||||||





Fourth grade
|
| ||||||||||||||||||||||||||||||||||||||||||||||||||||||||||||||||||||||||||||||||||||||||||||||||||||||||||||||||||||||||||||||||||||||||||||||||||||||||||||||||||||||||||||||
Additional initiatives
The TIMSS 1999 Video Study[31] was a study of eighth-grade mathematics and science teaching in seven countries. The study involved videotaping and analyzing teaching practices in more than one thousand classrooms. In conjunction with the IEA, the study was conducted by the US National Center for Education Statistics, and the US Department of Education under a contract with LessonLab, Inc. of Los Angeles, California.
Cooperative partners
TIMSS depends on the collaboration of a large number of individuals and organizations around the world including the TIMSS & PIRLS International Study Center at Boston College, IEA's offices in Amsterdam and Hamburg, Statistics Canada, and Educational Testing Service (ETS). In the United States, TIMSS is conducted by the National Center for Education Statistics of the US Department of Education. Data for US students is further tracked for ethnic and racial groups. TIMSS is mainly funded by the participating countries. Also, the US National Center for Education Statistics of the US Department of Education and the World Bank provide major support funding for the assessments.[5]
All average country scores
TIMSS and other international math and science studies
Hanushek and Woessmann[32] developed a methodology to rescale 14 different international comparisons of math and / or science achievement to make them comparable. This includes the FIMS, FISS, and PISA, mentioned above, with TIMSS.
This methodology is somewhat disputed amongst experts in quantitative methods used in educational and psychological measurement as it is basically only a linear scale transformation that cannot ensure or examine whether PISA and TIMSS scores are based on the same or at least comparable measurement constructs: The numerical values used to measure shoe size and intelligence can be transformed so that both have the same arithmetic mean and standard deviation, but they still represent two very different characteristics.
See also
- International Association for the Evaluation of Educational Achievement
- Programme for International Student Assessment (PISA), an educational ranking among OECD nations
- Progress in International Reading Literacy Study (PIRLS)
Notes
- "About TIMSS 2019". TIMSS International Study Center. Retrieved 15 December 2016.
- "TIMSS & PIRLS International Study Center". Retrieved 15 December 2016.
- Hanushek and Woessmann (2015, Table 2.1, p. 18).
- "TIMSS 2015 and TIMSS Advanced 2015 International Results". TIMSS International Study Center. Retrieved 15 December 2016.
- "TIMSS 2011 Participating Countries". Retrieved 21 Nov 2016.
- "TIMSS 2019 International Results in Mathematics and Science". Retrieved 3 May 2021.
- "TIMSS 2019 Assessment Frameworks". TIMSS & PIRLS International Study Center. Retrieved 3 May 2021.
- "Pursuing Excellence: Comparisons of International Eighth-Grade Mathematics and Science Achievement from a U.S. Perspective, 1995 and 1999" (PDF). U.S. Department of Education. December 2000. p. 2. Retrieved 4 May 2013.
- "TIMSS 2019 Assessment Frameworks". www.timssandpirls.bc.edu. Retrieved 3 May 2021.
- "TIMSS 2019 Encyclopedia: Education Policy and Curriculum in Mathematics and Science". www.timssandpirls.bc.edu. Retrieved 3 May 2021.
- "TIMSS 2019 Encyclopedia: Education Policy and Curriculum in Mathematics and Science". www.timssandpirls.bc.edu. Retrieved 3 May 2021.
- "TIMSS 2015 - IEA". www.iea.nl. Retrieved 18 April 2018.
- "About TIMSS 2015 – TIMSS 2015 and TIMSS Advanced 2015 International Results". timssandpirls.bc.edu. Retrieved 2017-03-21.
- "TIMSS 2011 - IEA". www.iea.nl. Retrieved 18 April 2018.
- "TIMSS 2007 - IEA". www.iea.nl. Retrieved 18 April 2018.
- "TIMSS 2007 Mathematics" (PDF).
- "TIMSS 2007 Science" (PDF).
- "TIMSS 2003 - IEA". www.iea.nl. Retrieved 18 April 2018.
- center, international study. "TIMSS 2003 Countries Participating". timssandpirls.bc.edu. Retrieved 2017-03-21.
- "TIMSS 2003 Mathematics" (PDF).
- "TIMSS 2003 Science" (PDF).
- "TIMSS 1999 - IEA". www.iea.nl. Retrieved 18 April 2018.
- "TIMSS 1999 Participants". timssandpirls.bc.edu. Retrieved 2017-03-21.
- "TIMSS 1999 Mathematics" (PDF).
- "TIMSS 1999 Science" (PDF).
- "TIMSS 1995 - IEA". www.iea.nl. Retrieved 18 April 2018.
- "TIMSS 1995 Mathematics (8th grade)" (PDF).
- "TIMSS 1995 Science (8th grade)" (PDF).
- "TIMSS 1995 Mathematics (4th grade)" (PDF).
- "TIMSS 1995 Science (4th grade)" (PDF).
- http://www.timssvideo.com/
- Hanushek and Woessman (2015, esp. Table 2.1 and Appendix 2A, pp. 18, 29-37)
References
- Hanushek, Eric A.; Woessmann, Ludger (2015), The knowledge capital of nations, CESifo, ISBN 978-0-262-02917-9.
External links
- IEA's TIMSS & PIRLS International Study Center at Boston College
- www.iea.nl: TIMSS. Trends in International Mathematics and Science Study
- U.S. Department of Education TIMSS
- TIMSS: What Have We Learned about Math and Science Teaching? - Education Resources Information Center Clearinghouse for Science Mathematics and Environmental Education, Columbus, Ohio.
- Benchmarking to the world's best in mathematics. Quality control in curriculum and instruction among the top performers in the TIMSS