Table of spherical harmonics
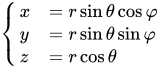
This is a table of orthonormalized spherical harmonics that employ the Condon-Shortley phase up to degree . Some of these formulas give the "Cartesian" version. This assumes x, y, z, and r are related to and through the usual spherical-to-Cartesian coordinate transformation:


Complex Spherical harmonics
For ℓ = 0, …, 5, see.[1]
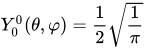
ℓ = 0
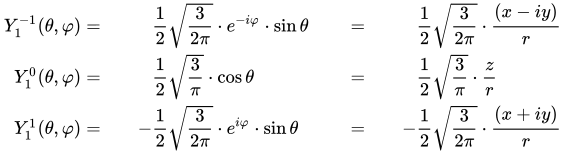
ℓ = 1
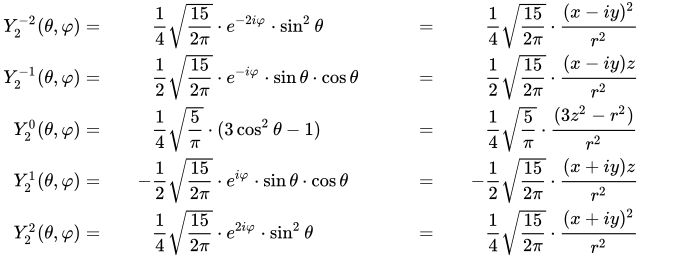
ℓ = 2
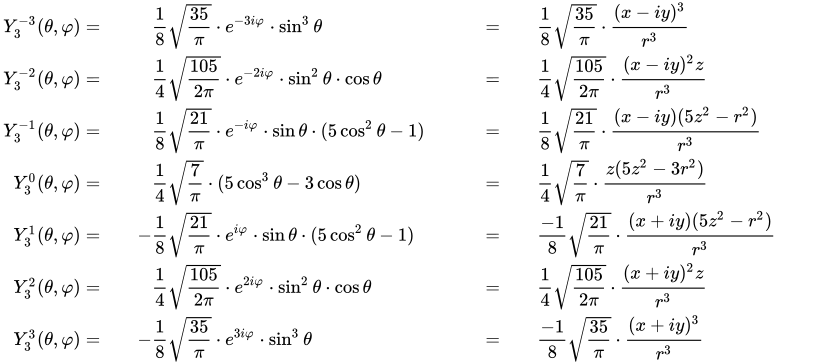
ℓ = 3
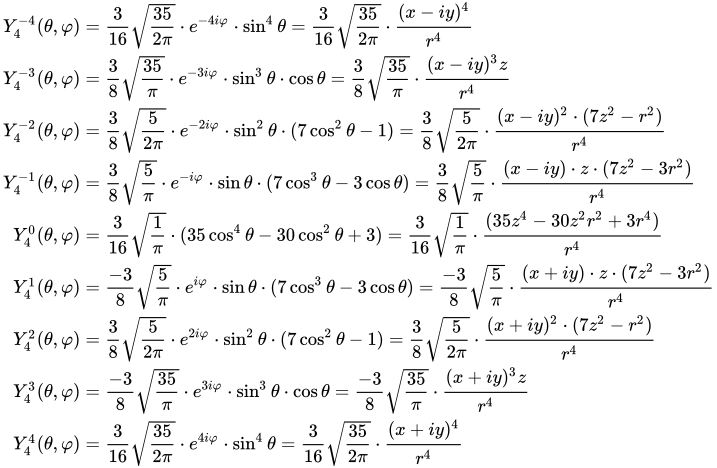
ℓ = 4
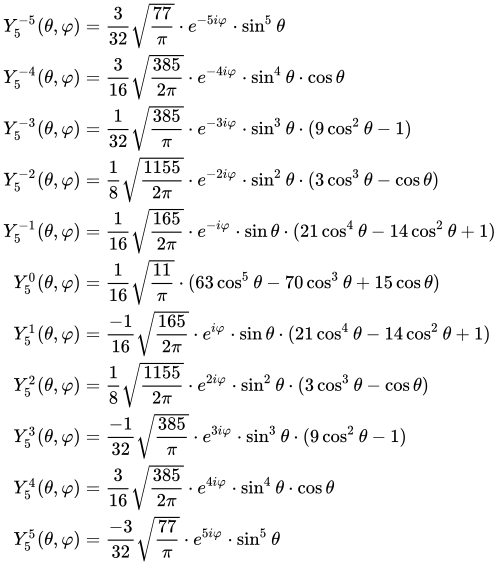
ℓ = 5
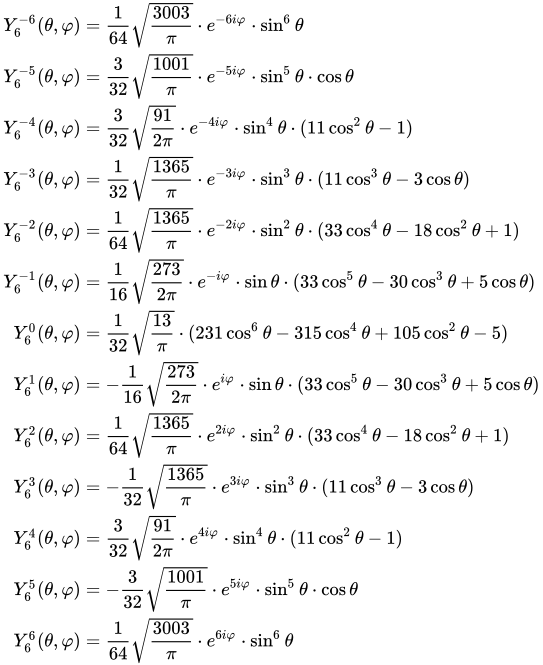
ℓ = 6
ℓ = 7
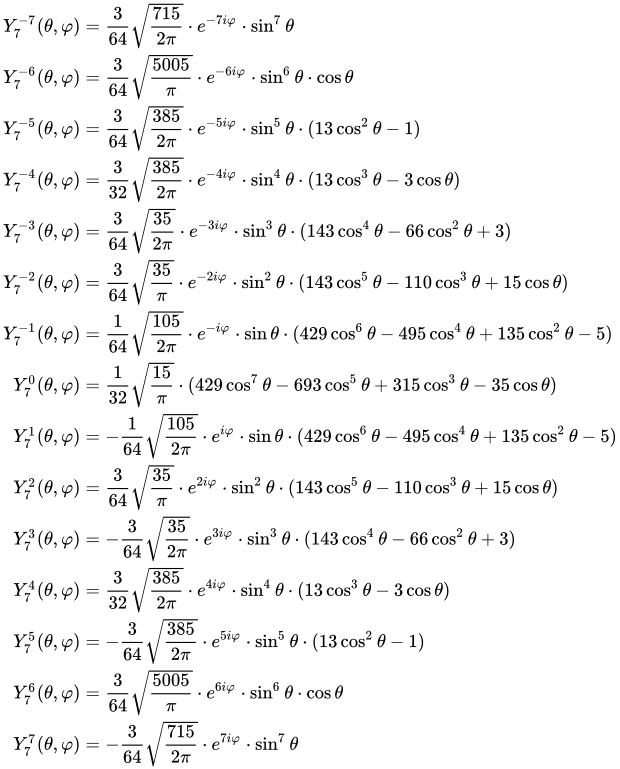
ℓ = 8
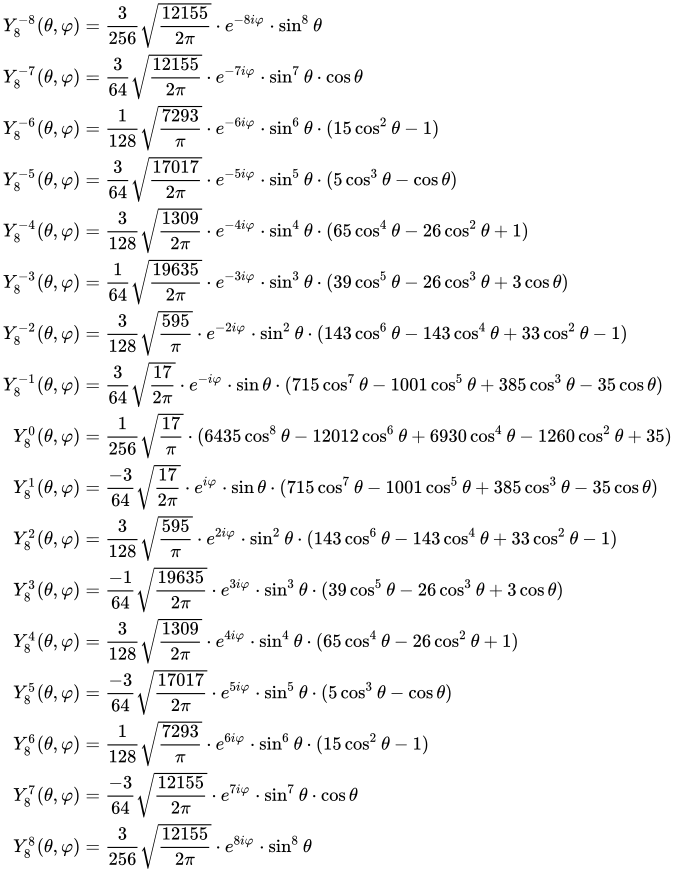
ℓ = 9
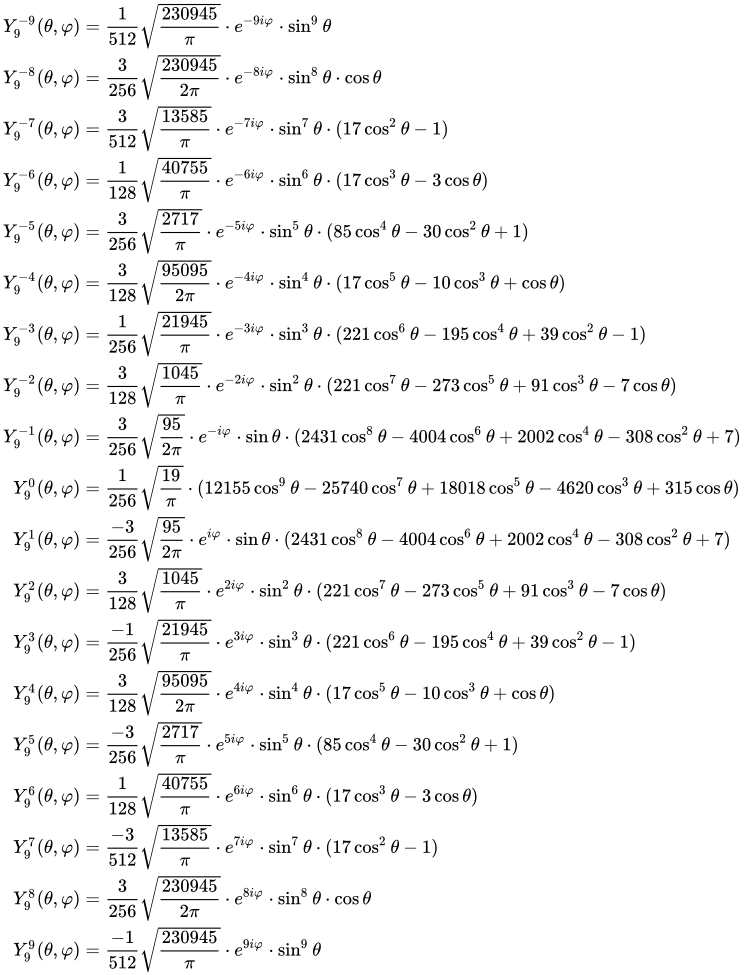
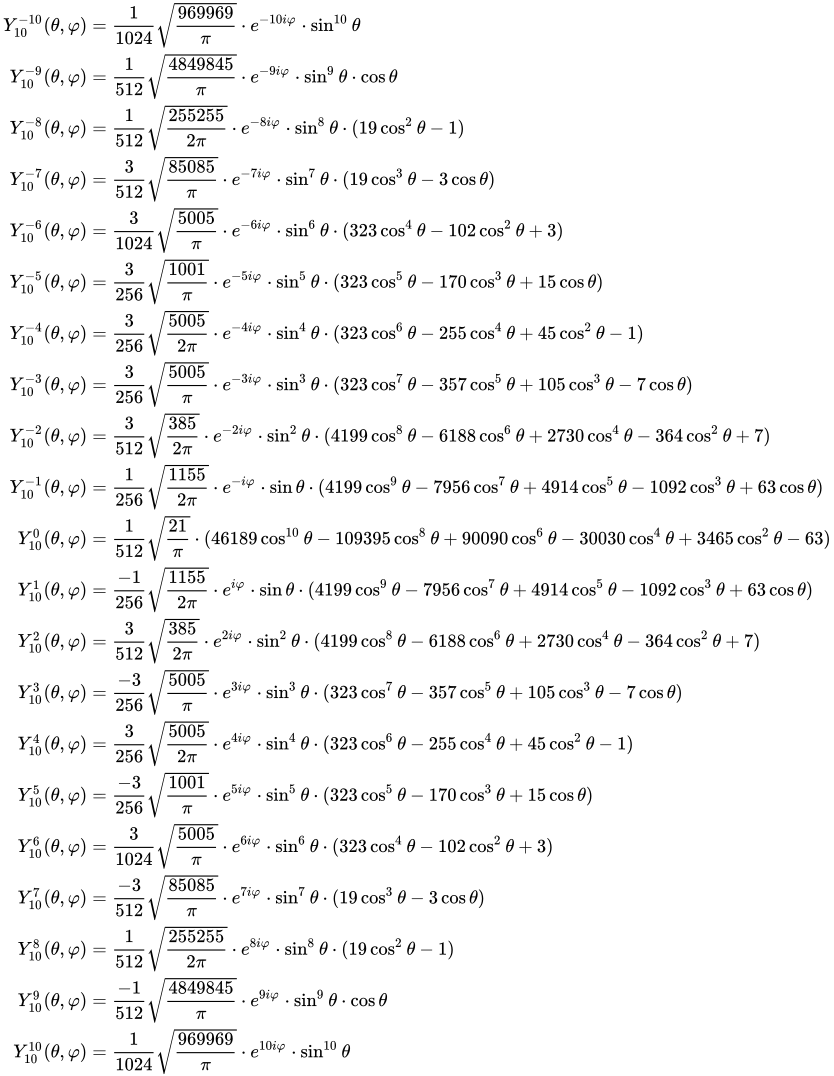
ℓ = 10
Visualization of Complex Spherical Harmonics
2D polar/azimuthal angle maps
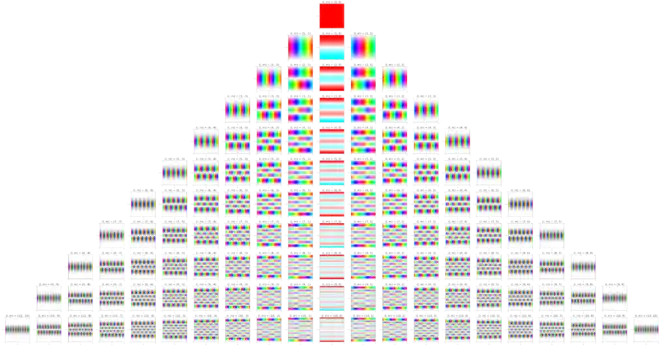
Below the complex spherical harmonics are represented on 2D plots with the azimuthal angle, , on the horizontal axis and the polar angle, , on the vertical axis. The saturation of the color at any point represents the magnitude of the spherical harmonic and the hue represents the phase.

Polar Plots
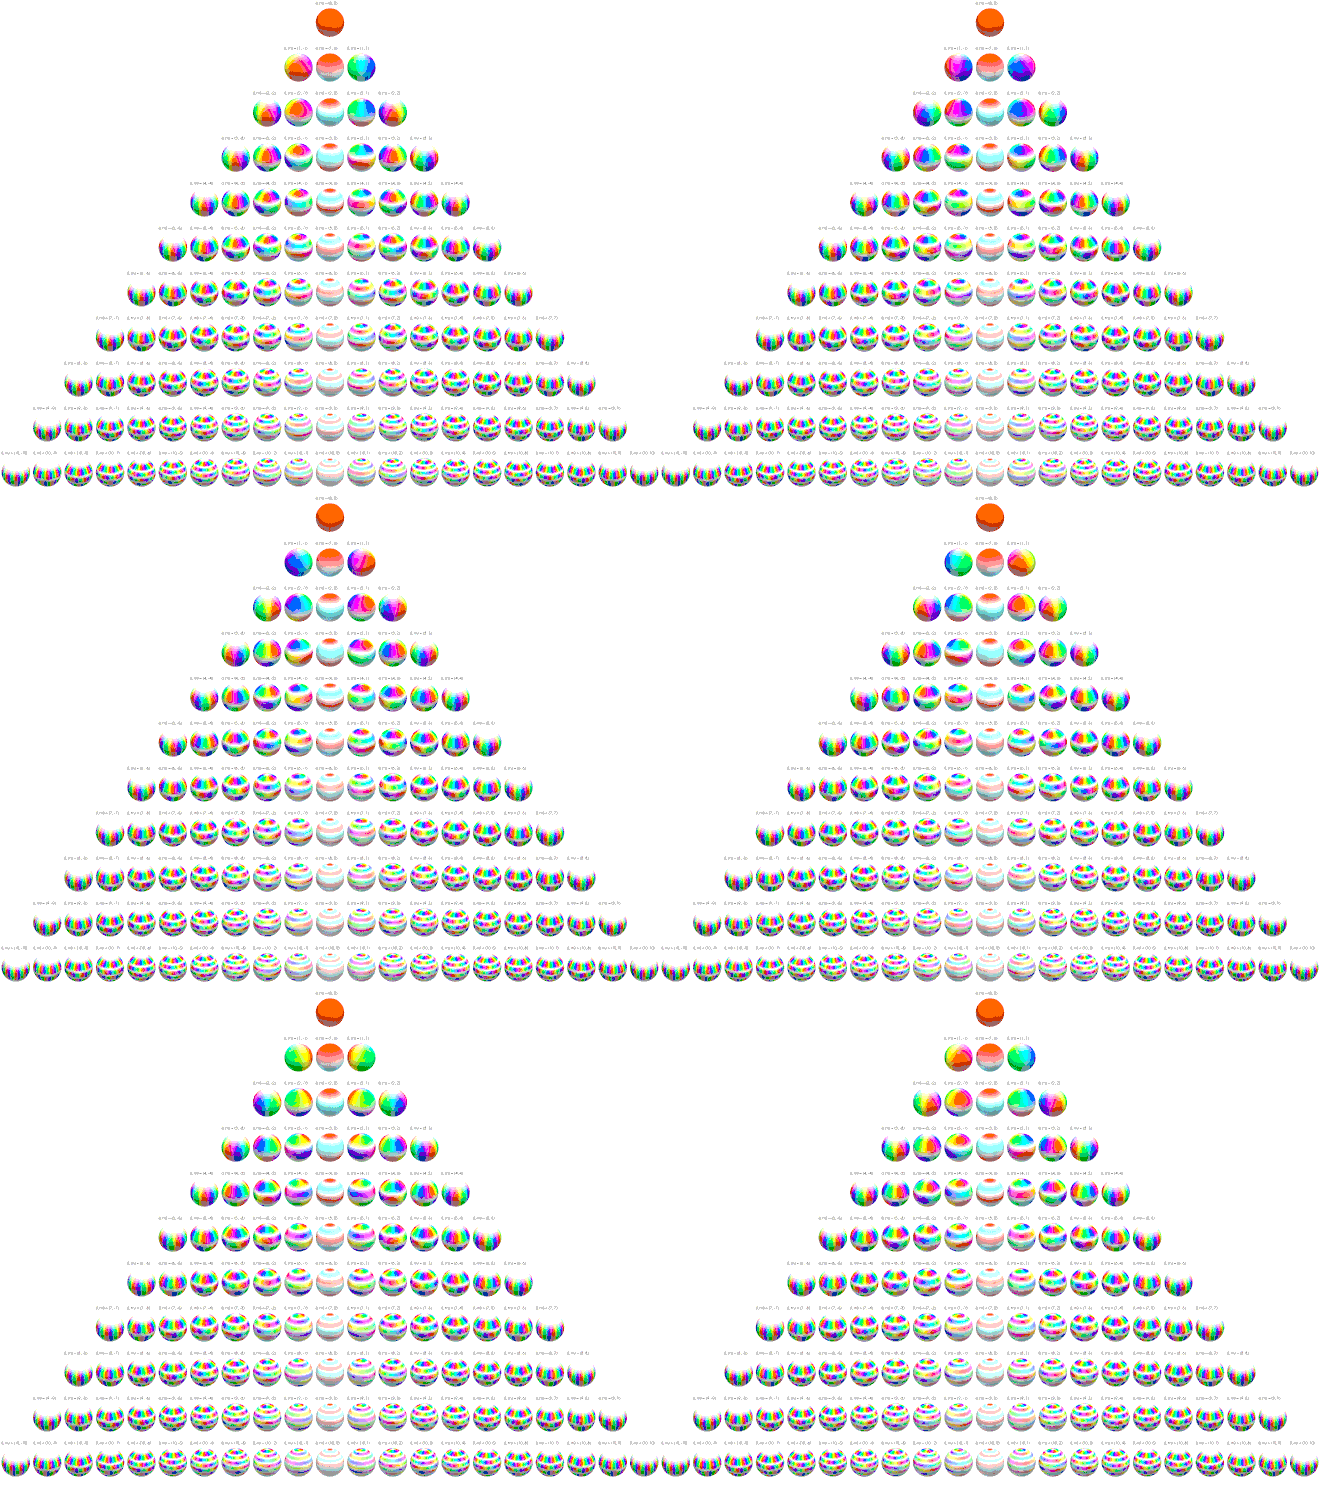
Below the complex spherical harmonics are represented on polar plots. The magnitude of the spherical harmonic at particular polar and azimuthal angles is represented by the saturation of the color at that point and the phase is represented by the hue at that point.
Polar Plots with Magnitude as Radius
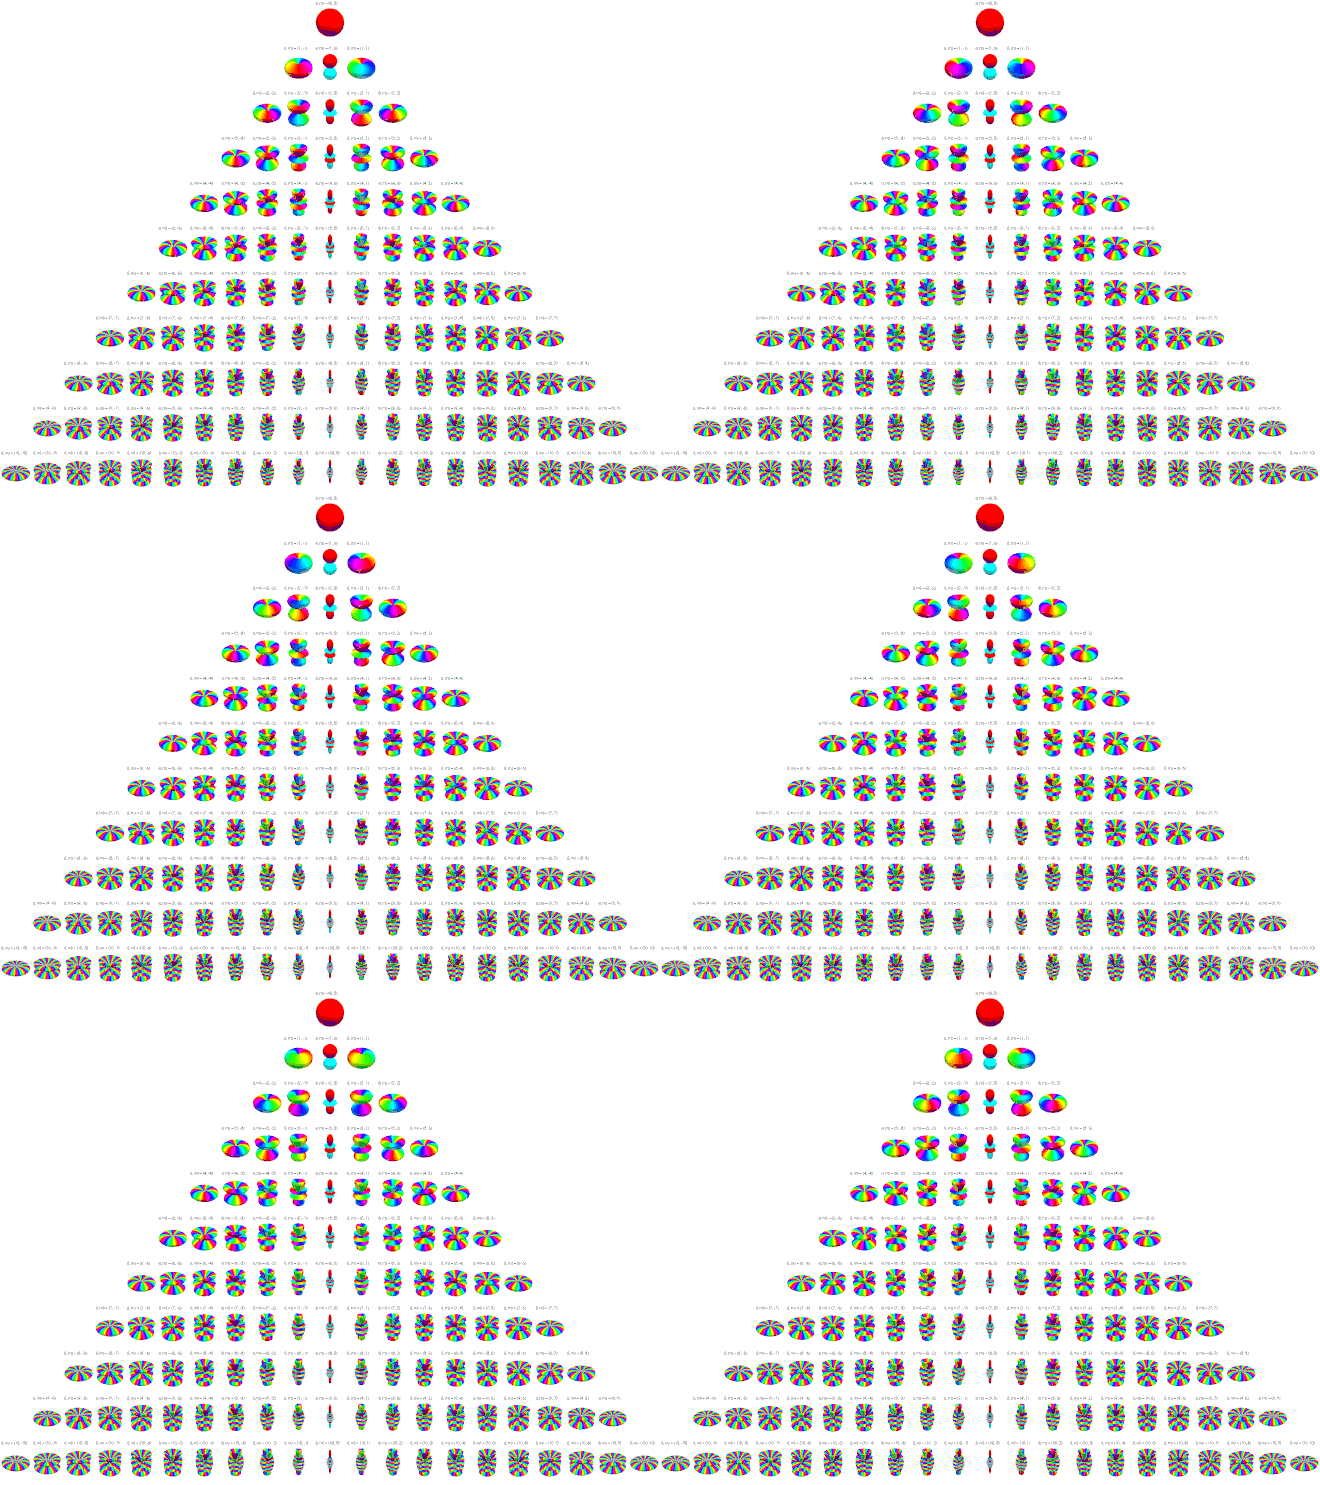
Below the complex spherical harmonics are represented on polar plots. The magnitude of the spherical harmonic at particular polar and azimuthal angles is represented by the radius of the plot at that point and the phase is represented by the hue at that point.
Real spherical harmonics
For each real spherical harmonic, the corresponding atomic orbital symbol (s, p, d, f, g) is reported as well.
ℓ = 0
ℓ = 1
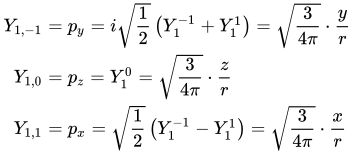
ℓ = 2
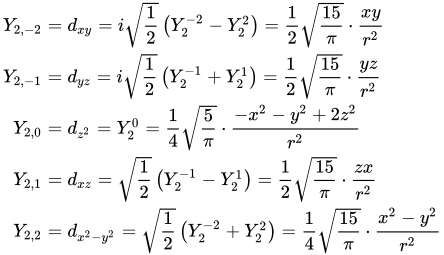
ℓ = 3
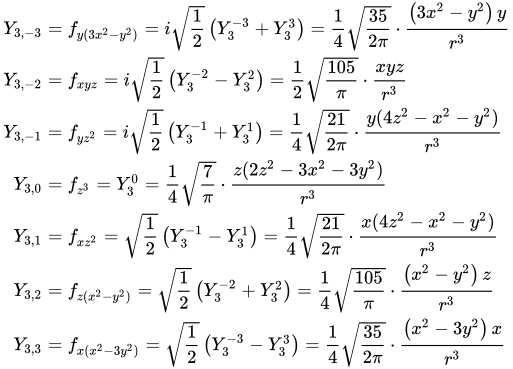
ℓ = 4
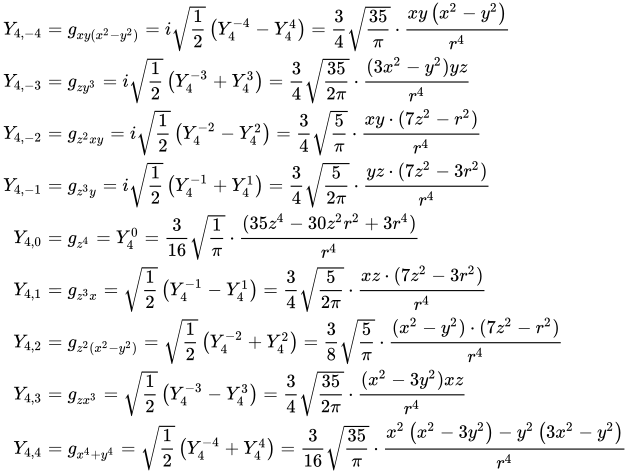
Visualization of Real Spherical Harmonics
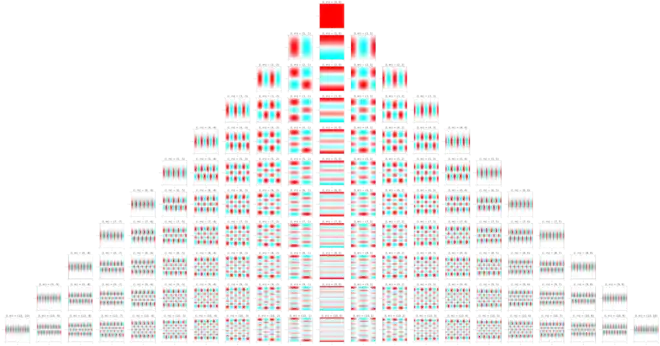
2D polar/azimuthal angle maps
Below the real spherical harmonics are represented on 2D plots with the azimuthal angle, , on the horizontal axis and the polar angle, , on the vertical axis. The saturation of the color at any point represents the magnitude of the spherical harmonic and the hue represents the phase.
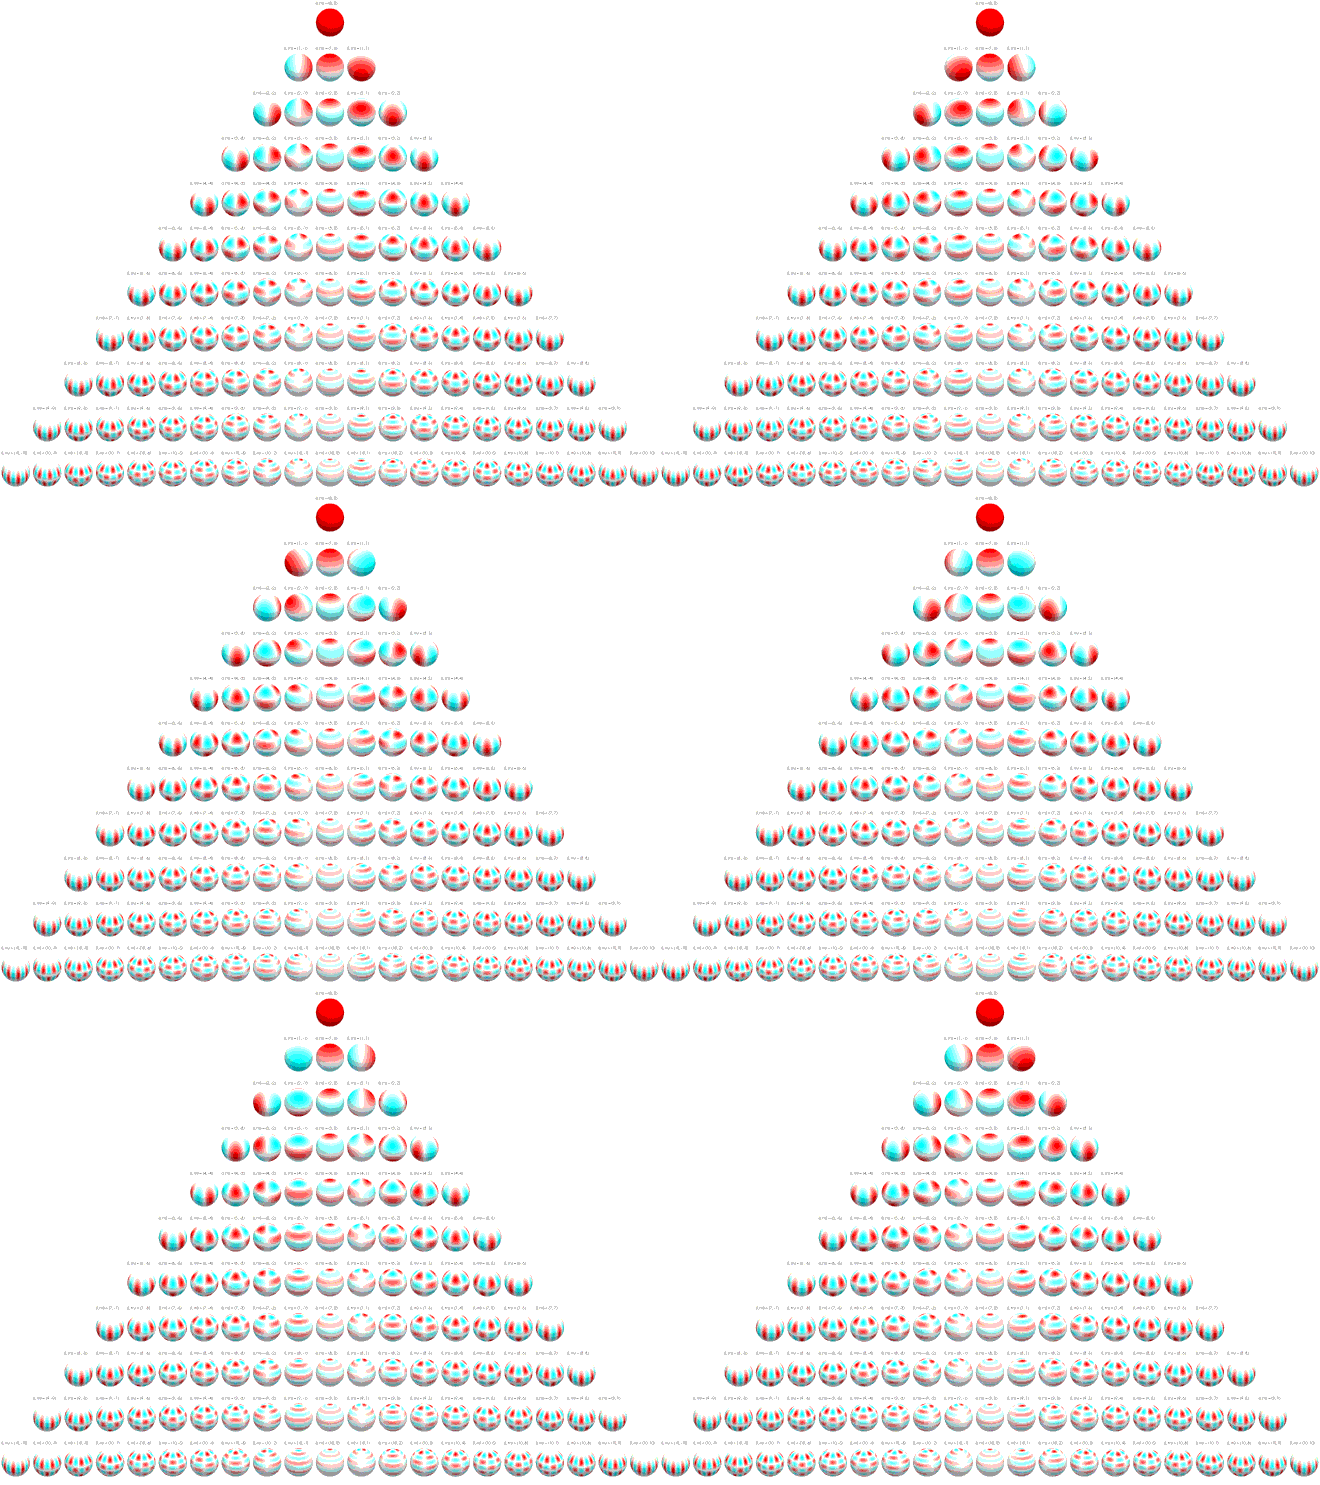
Polar Plots
Below the real spherical harmonics are represented on polar plots. The magnitude of the spherical harmonic at particular polar and azimuthal angles is represented by the saturation of the color at that point and the phase is represented by the hue at that point.
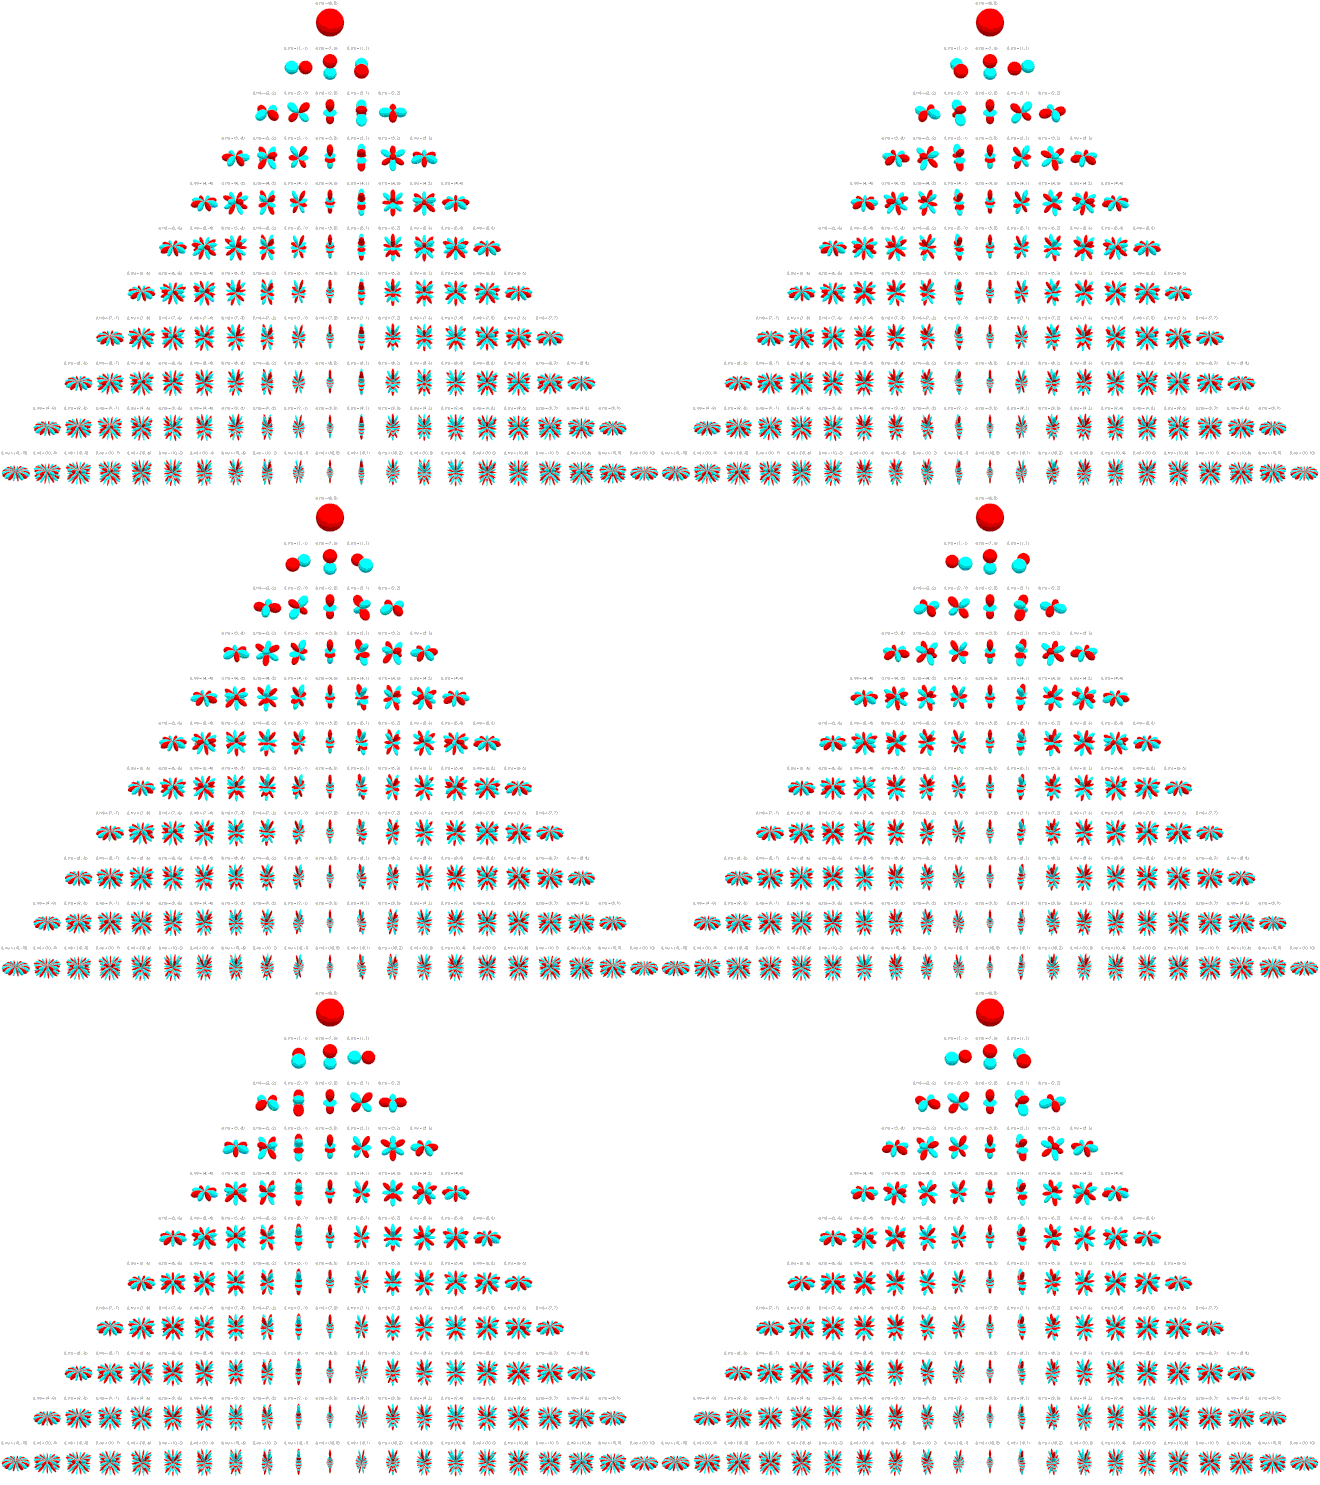
Polar Plots with Magnitude as Radius
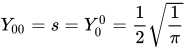
Below the real spherical harmonics are represented on polar plots. The magnitude of the spherical harmonic at particular polar and azimuthal angles is represented by the radius of the plot at that point and the phase is represented by the hue at that point.
See also
External links
References
Cited references
- D. A. Varshalovich; A. N. Moskalev; V. K. Khersonskii (1988). Quantum theory of angular momentum : irreducible tensors, spherical harmonics, vector coupling coefficients, 3nj symbols (1. repr. ed.). Singapore: World Scientific Pub. pp. 155–156. ISBN 9971-50-107-4.
- C.D.H. Chisholm (1976). Group theoretical techniques in quantum chemistry. New York: Academic Press. ISBN 0-12-172950-8.
- Blanco, Miguel A.; Flórez, M.; Bermejo, M. (1 December 1997). "Evaluation of the rotation matrices in the basis of real spherical harmonics". Journal of Molecular Structure: THEOCHEM. 419 (1–3): 19–27. doi:10.1016/S0166-1280(97)00185-1.
General references
- See section 3 in Mathar, R. J. (2009). "Zernike basis to cartesian transformations". Serbian Astronomical Journal. 179 (179): 107–120. arXiv:0809.2368. Bibcode:2009SerAJ.179..107M. doi:10.2298/SAJ0979107M. (see section 3.3)
- For complex spherical harmonics, see also SphericalHarmonicY[l,m,theta,phi] at Wolfram Alpha, especially for specific values of l and m.