2020 Pacific hurricane season
The 2020 Pacific hurricane season was the least active Pacific hurricane season since 2011. The season was near average in terms of tropical storms, featuring a total of 17, but had a well below average number of hurricanes and major hurricanes, with only 4 hurricanes and 3 major hurricanes forming including one unnamed tropical storm which was operationally classified as a tropical depression, the first such occurrence since 2001. Despite this, it featured the earliest start to a season east of 140°W on record, with Tropical Depression One-E forming on April 25. The season officially began on May 15 in the East Pacific Ocean, and on June 1 in the Central Pacific and they both ended on November 30. These dates conventionally delimit the period of each year when most tropical cyclones form in the Pacific basin. However, the formation of tropical cyclones is possible at any time of the year, as shown by the record-early formation of Tropical Depression One-E.
| 2020 Pacific hurricane season | |
|---|---|
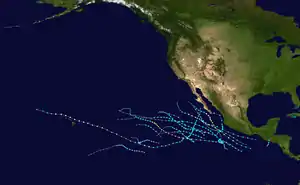 Season summary map | |
| Seasonal boundaries | |
| First system formed | April 25, 2020 |
| Last system dissipated | November 19, 2020 |
| Strongest storm | |
| Name | Marie |
| • Maximum winds | 140 mph (220 km/h) (1-minute sustained) |
| • Lowest pressure | 945 mbar (hPa; 27.91 inHg) |
| Seasonal statistics | |
| Total depressions | 21 |
| Total storms | 17 |
| Hurricanes | 4 |
| Major hurricanes (Cat. 3+) | 3 |
| Total fatalities | 47 total |
| Total damage | ≥ $250 million (2020 USD) |
| Related articles | |
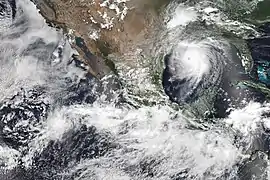
The most significant storms of the season were Tropical Storm Amanda and Hurricane Genevieve. Amanda developed near Central America in late May and struck Guatemala, causing widespread damage in neighboring El Salvador and killing 40 people amid the COVID-19 pandemic in the latter country. Genevieve passed closely to the tip of the Baja California Peninsula in August, bringing hurricane-force winds and heavy rainfall, killing six and causing an estimated $50 million in damage. Otherwise, impact from other storms was minimal. In late July, Hurricane Douglas made an extremely close pass to Hawaii, with its weak southern eyewall crossing Oahu, causing minor effects. The remnant moisture of Tropical Storm Fausto brought dry thunderstorms and lightning to Northern California, sparking hundreds of fires, and the remnants of Genevieve dropped heavy rainfall in Arizona and Southern California. Tropical Storm Hernan moved very near the coast of Mexico and made landfall in Baja California Sur as a tropical depression, causing an additional fatality. The final storm of the season, Tropical Storm Polo, dissipated on November 19, about 11 days before the official end of the season. Collectively, the tropical cyclones of this season caused about US$250 million in damage and 47 deaths.
Seasonal forecasts
| Record | Named storms |
Hurricanes | Major hurricanes |
Ref | |
|---|---|---|---|---|---|
| Average (1981–2010): | 15.4 | 7.6 | 3.2 | [1] | |
| Record high activity: | 1992: 27 | 2015: 16 | 2015: 11 | [2] | |
| Record low activity: | 2010: 8 | 2010: 3 | 2003: 0 | [2] | |
| Date | Source | Named storms |
Hurricanes | Major hurricanes |
Ref |
| May 20, 2020 | SMN | 15–18 | 8–10 | 4–5 | [3] |
| May 21, 2020 | NOAA | 11–18 | 5–10 | 1–5 | [4] |
| Area | Named storms | Hurricanes | Major hurricanes | Ref | |
| Actual activity: | EPAC | 17 | 4 | 3 | |
| Actual activity: | CPAC | 0 | 0 | 0 | |
| Actual activity: | 17 | 4 | 3 | ||
On May 20, 2020, the Servicio Meteorológico Nacional (SMN) issued its forecast for the season, predicting a total of 15–18 named storms, 8–10 hurricanes, and 4–5 major hurricanes to develop.[3] The next day, the National Oceanic and Atmospheric Administration (NOAA) issued their outlook, calling for a below-normal to near-normal season with 11–18 named storms, 5–10 hurricanes, 1–5 major hurricanes, and an accumulated cyclone energy index of 60% to 135% of the median. Factors they expected to reduce activity were near- or below-average sea surface temperatures across the eastern Pacific and the El Niño–Southern Oscillation remaining in the neutral phase, with the possibility of a La Niña developing.[4]
Seasonal summary
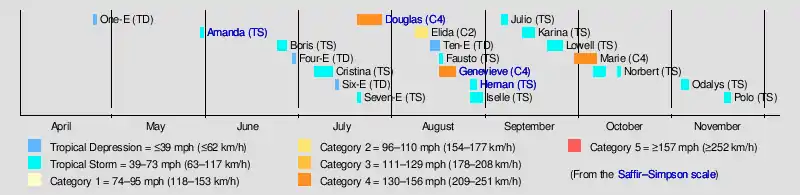
Although the hurricane season in the eastern Pacific does not officially begin until May 15, and on June 1 in the central Pacific,[5] activity this year began several weeks prior with the formation of Tropical Depression One-E on April 25. This marked the earliest formation of a tropical cyclone in the basin, surpassing 2017's Tropical Storm Adrian.[6] Among relatively unfavorable conditions, the depression was short lived,[7] and activity would not resume in the basin until nearly a month later with the formation of Tropical Depression Two-E near the coast of Guatemala on May 30. This system would later become Tropical Storm Amanda, the first named storm of the season and one of the worst natural disasters in El Salvador in around two decades.[8][9] Not for nearly another month after Amanda, Tropical Depression Three-E would briefly become Tropical Storm Boris on June 25 well out to sea before weakening in the Central Pacific basin.[10][11] A short-lived tropical depression would form near Baja California Sur just 2 days after Boris's dissipation and quickly weaken.[12] Moving into July, Tropical Storm Cristina formed on July 6 and slowly intensified to a peak intensity of 70 miles per hour (110 km/h), barely missing hurricane status.[13][14] Activity continued as yet another tropical depression, Six-E, formed on July 13 but quickly dissipated among the unfavorable conditions unfolding in the basin.[15] Two more tropical systems formed in mid July, Tropical Depression Seven-E and Tropical Storm Douglas. Seven-E was short lived and although it did gain tropical storm intensity, it was operationally left unnamed. Douglas strengthened into the first hurricane of the season at 15:00 UTC on July 22, marking the fourth–latest date any season had gone without a hurricane. Douglas would later strengthen into a Category 4 hurricane and brush Hawaii with rain and gusty winds.[16]
| Rank | Seasons | ACE value |
|---|---|---|
| 1 | 1977 | 22 |
| 2 | 2007 | 52 |
| 2010 | ||
| 4 | 1996 | 53 |
| 5 | 2003 | 56 |
| 6 | 1979 | 57 |
| 7 | 2004 | 71 |
| 8 | 1981 | 72 |
| 9 | 2020 | 73 |
| 10 | 2013 | 76 |
A burst of activity occurred in early August, with a tropical wave south of Mexico evolving into Tropical Storm Elida on August 9, later to become the second hurricane of the season. Elida was generally short lived, but with the formation of Tropical Depression Ten-E, Tropical Storm Fausto, and Hurricane Genevieve activity continued. Genevieve later became the second major hurricane of the season before briefly effecting Baja California Sur as a minimal hurricane. Two additional tropical cyclones, Tropical Storms Hernan and Iselle, formed in late August. Both were generally weak and did not make landfall, although the former brought heavy flooding and mudslides to western Mexico. Later, on September 5, the remnants of former Atlantic tropical cyclone Nana reformed into a new cyclone in the Pacific named Julio. After Julio, Karina and Lowell formed. Near the end of September, Hurricane Marie formed and rapidly intensified up to Category 4 strength before weakening out to sea, becoming the strongest storm of the season. The only October storm of the season, Norbert, lasted for 10 days. After almost a month of inactivity, Odalys formed on November 3, and dissipated three days later without affecting land. Tropical Storm Polo formed close to the end of the season, but it was also short-lived and weak.
The accumulated cyclone energy (ACE) index for the 2020 Pacific hurricane season was 61.08 units in the Eastern Pacific and 12.7 units in the Central Pacific. The total ACE in the basin was 73.78 units.[nb 1] Broadly speaking, ACE is a measure of the power of a tropical or subtropical storm multiplied by the length of time it existed. It is only calculated for full advisories on specific tropical and subtropical systems reaching or exceeding wind speeds of 39 miles per hour (63 km/h).
Systems
Tropical Depression One-E
| Tropical depression (SSHWS) | |
  | |
| Duration | April 25 – April 26 |
|---|---|
| Peak intensity | 35 mph (55 km/h) (1-min) 1006 mbar (hPa) |
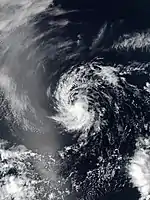
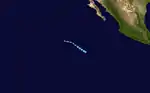
A disturbance developed within the Intertropical Convergence Zone (ITCZ) on April 17. The disturbance moved westward within the ITCZ over the next several days, and after developing a well-defined center and organized convection, it was designated as Tropical Depression One-E at 06:00 UTC on April 25 about 700 nautical miles southwest of the southern tip of the Baja California Peninsula. Moving northwestward, the depression retained organized deep convection until shortly after 00:00 UTC the next day. Dry air and westerly wind shear caused the depression to weaken and degenerate to a remnant low by 12:00 UTC. The remnant low turned west and opened up into a trough at 18:00 UTC on April 27.[17]
One-E was the earliest forming tropical cyclone in the northeastern Pacific proper (east of 140W) since the dawn of the satellite era in 1966; surpassing, at the time, Tropical Storm Adrian of 2017 by two weeks. However, 2021's Tropical Storm Andres retains the title of the earliest named storm in the basin, because One-E did not achieve tropical storm force winds and therefore was not given a name.[17]
Tropical Storm Amanda
| Tropical storm (SSHWS) | |
  | |
| Duration | May 30 – May 31 |
|---|---|
| Peak intensity | 40 mph (65 km/h) (1-min) 1003 mbar (hPa) |
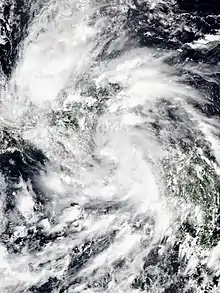
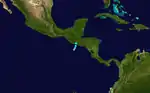
A broad area of low pressure developed near an area of convection over the far eastern portion of the basin on May 27. Meanwhile, a tropical wave that had left the coast of Africa around May 18 crossed Panama into the Eastern Pacific on May 29. The wave caused the low-pressure area to become more organized and develop a well-defined circulation, and it became Tropical Depression Two-E at 18:00 UTC on May 30. Moving northeastward around the periphery of a large cyclonic gyre over northern Central America, the depression continued to organize and compact in size, strengthening into Tropical Storm Amanda at 06:00 UTC the next day. About four hours later, Amanda made landfall at peak intensity near Las Lisas, Guatemala. Amanda rapidly degenerated as it moved inland, with its center dissipating around 18:00 UTC. The remnants of the system moved northward into the Bay of Campeche and re-developed into the Atlantic Tropical Depression Three at 21:00 UTC on June 1, which would later become Tropical Storm Cristobal.[18]
In El Salvador, torrential rainfall caused significant damage along coastal cities in the country as rivers overflowed and swept away buildings.[19] Amanda killed 14 people in El Salvador,[20] of which at least six died due to flash flooding, and one died from a collapsed home.[21] More than 900 homes were damaged across the country and 1,200 families were evacuated to 51 shelters across La Libertad, San Salvador, Sonsonate, and San Vicente. In the capital, San Salvador, 50 houses were destroyed and 23 vehicles fell into a sinkhole.[22][23] El Salvador President Nayib Bukele declared a 15-day national state of emergency due to the storm.[21] Movement restrictions in place for the ongoing COVID-19 pandemic were temporarily lifted to allow people to purchase medicines, while hardware stores were allowed to open with limited capacity so people could purchase equipment for repairs.[22]
Tropical Storm Boris
| Tropical storm (SSHWS) | |
  | |
| Duration | June 24 – June 27 |
|---|---|
| Peak intensity | 40 mph (65 km/h) (1-min) 1005 mbar (hPa) |
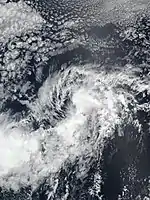
The interaction between a tropical wave, a preexisting area of disturbed weather, and the Madden-Julian Oscillation led to the formation of a surface low late on June 23. Deep convection coalesced with this circulation over the ensuing hours, and a tropical depression developed around 06:00 UTC on June 24. The system struggled via the effects of nearby dry air and some wind shear as it moved west to west-northwest under the subtropical ridge. Nonetheless, it intensified into Tropical Storm Boris around 18:00 UTC on June 25 when deep convection was most prevalent. A further increase in upper-level winds prevented Boris from strengthening beyond minimal tropical storm intensity, and it instead weakened to a tropical depression again twelve hours later before crossing into the central Pacific basin. All associated thunderstorm activity dissipated by June 28, and Boris degenerated to a remnant area of low pressure by 00:00 UTC that day. The post-tropical cyclone curved west-southwest and dissipated well south-southeast of the Hawaiian Islands on June 30.[24]
Tropical Depression Four-E
| Tropical depression (SSHWS) | |
  | |
| Duration | June 29 – June 30 |
|---|---|
| Peak intensity | 30 mph (45 km/h) (1-min) 1006 mbar (hPa) |
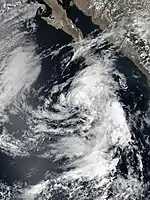
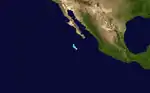
A broad area of disturbed weather, at least partially enhanced by a tropical wave, formed near the Gulf of Tehuantepec on June 25. The system paralleled the Mexican coastline and only slowly organized over the coming days, eventually meeting the criteria to be designated a tropical depression around 18:00 UTC on June 29. Despite coalescing deeper convection near the center at the time of formation, Tropical Depression Four-E failed to attain winds greater than 30 mph (45 km/h) as it encountered hostile southwesterly wind shear and colder ocean waters. Instead, the system degenerated to a remnant area of low pressure by 18:00 UTC on June 30. The low turned north and dissipated well south of Baja California on July 1.[25]
Tropical Storm Cristina
| Tropical storm (SSHWS) | |
  | |
| Duration | July 6 – July 12 |
|---|---|
| Peak intensity | 70 mph (110 km/h) (1-min) 993 mbar (hPa) |
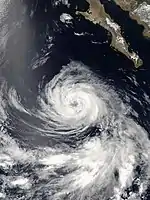
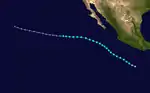
A tropical wave emerged off the west coast of Africa on June 20 and progressed west across the Atlantic and Caribbean. Oppressive dry air from the Saharan Air Layer prevented any development during this period. Crossing Central America on July 3, the wave interacted with a monsoon trough and deep convection blossomed and gradually organized. This system developed a defined surface low on July 6 and was classified as a tropical depression about 435 mi (705 km) south of Acapulco, Mexico. Steered along a northwest trajectory by a mid-level ridge, the depression traversed a region of warm water, moist mid-level air, and moderate wind shear; these factors enabled slow intensification. After strengthening into Tropical Storm Cristina on July 7, the NHC anticipated significant intensification as wind shear was forecast to decrease. However, the wind shear remained in place and Cristina did not organize as fast as expected. Cristina reached its peak intensity late on July 10 with winds of 70 mph (110 km/h) and a pressure of 993 mbar (hPa; 29.33 inHg) as it passed west of Socorro Island. Thereafter, the cyclone turned west along the south side of the subtropical ridge. Cristina gradually spun down as sea surface temperatures decreased and the surrounding environment became more stable. The storm degraded into a remnant low on July 12 and degenerated into a trough on July 15 about halfway between Hawaii and the Baja California Peninsula.[26]
Tropical Depression Six-E
| Tropical depression (SSHWS) | |
  | |
| Duration | July 13 – July 14 |
|---|---|
| Peak intensity | 35 mph (55 km/h) (1-min) 1007 mbar (hPa) |
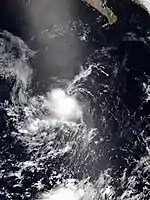
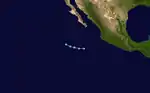
A tropical wave, emerging off Africa on July 2, fractured over the western Atlantic several days later. The southern wave axis continued into the eastern Pacific, where its interaction with the monsoon trough resulted in the formation of an area of low pressure. This low failed to organize for a few days as it was hindered by strong northeasterly wind shear, and indeed it briefly opened up into a trough. On July 13, a burst of extremely deep convection led to the redevelopment of a new circulation, and the system organized into a tropical depression around 12:00 UTC that day. As the cyclone moved west-northwest away from Mexico, its associated convection waned, preventing the system from intensifying to a tropical storm. Instead, Tropical Depression Six-E dissipated into an open trough once again around 18:00 UTC on July 14.[27]
Tropical Storm Seven-E
| Tropical storm (SSHWS) | |
  | |
| Duration | July 20 – July 21 |
|---|---|
| Peak intensity | 40 mph (65 km/h) (1-min) 1006 mbar (hPa) |
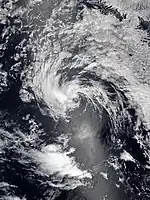
At 12:00 UTC on July 15, the NHC began to track a tropical wave moving across the southern portion of the basin. The wave spawned an area of low pressure further west at 12:00 UTC on July 19 and gradually organized, forming into Tropical Depression Seven-E at 00:00 UTC on July 20. Forming over a rather hostile environment, a dry environment, and cool sea surface temperatures (SSTs) operationally appeared to prevent the depression from strengthening. However, post-storm analysis revealed that an improvement in central convection had occurred and a relatively strong band had formed on the northeast side of the system. That coupled with an ASCAT pass which revealed sustained winds of 39 mph (63 km/h) on the south side indicated the depression had intensified to tropical storm strength at 12:00 UTC on July 20. However, the system became devoid of all deep convection due to cold sea surface temperatures despite maintaining its strength and by 06:00 UTC on July 21, Seven-E was downgraded to a post-tropical cyclone without being named due to continued unfavorable conditions. The low then spun down and dissipated by 00:00 UTC on July 22.[28]
Hurricane Douglas
| Category 4 hurricane (SSHWS) | |
  | |
| Duration | July 20 – July 28 |
|---|---|
| Peak intensity | 130 mph (215 km/h) (1-min) 954 mbar (hPa) |
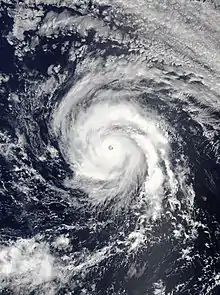
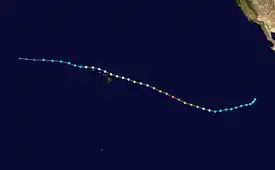
A tropical wave emerged off the west coast of Africa over the Atlantic Ocean on July 8 and traveled west. Crossing South and Central America from July 12–15, the system later entered the Eastern Pacific basin. Over the next five days, convection gradually organized around a consolidating surface low and a tropical depression developed on July 20 about 805 mi (1,295 km) southwest of the southern tip of Baja California Sur. Traveling along the south side of a mid-level ridge, the system steadily organized within a favorable environment and became a tropical storm later that day. Intensification was briefly halted by intrusions of dry air, but once this abated Douglas underwent rapid intensification. The system became a hurricane late on July 22 and reached its peak strength as a Category 4 hurricane early on July 24; maximum sustained winds were estimated at 130 mph (215 km/h) and its central pressure fell to 954 mbar (hPa; 28.17 inHg). Shortly thereafter, the hurricane crossed into the Central Pacific basin on a course toward Hawaii. Lower sea surface temperatures led to gradual weakening of the hurricane as it approached the state. On July 27, the center of Douglas passed just 60 mi (95 km) north of the main Hawaiian Islands;[29] despite its proximity, effects were negligible.[30] Increasing wind shear caused Douglas to rapidly unfold on July 28, resulting in its degradation to a tropical storm and ultimately its dissipation later that day well to the southeast of Midway Atoll.[29]
Hurricane Elida
| Category 2 hurricane (SSHWS) | |
  | |
| Duration | August 8 – August 12 |
|---|---|
| Peak intensity | 105 mph (165 km/h) (1-min) 971 mbar (hPa) |
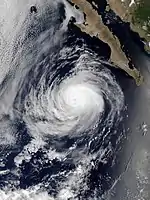
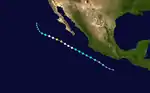
A tropical wave emerged off Africa on July 26 and split over the Caribbean several days later, with the southern portion of the wave continuing into the eastern Pacific. A small low developed in association with this wave, eventually organizing into a tropical depression by 18:00 UTC on August 8. Twelve hours later, the depression intensified into Tropical Storm Elida while paralleling the coastline of Mexico. Owing to favorable environmental conditions, Elida intensified steadily on August 9 and then rapidly the following day, attaining hurricane strength around 18:00 UTC on August 10. An eye developed within the storm's compact and symmetrical central dense overcast, and Elida reached peak winds of 105 mph (165 km/h) by 12:00 UTC the next morning. Ultimately, the influence of dry air and cooler waters caused the storm to swiftly weaken, and it degenerated to a remnant area of low pressure by 00:00 UTC on August 13 while positioned west of Baja California Sur. The low turned north before opening up into a trough a little over 24 hours later.[31]
Tropical Depression Ten-E
| Tropical depression (SSHWS) | |
  | |
| Duration | August 13 – August 16 |
|---|---|
| Peak intensity | 35 mph (55 km/h) (1-min) 1004 mbar (hPa) |
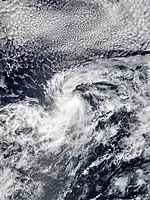
On August 10, an area of disturbed tropical weather formed about 1,500 miles west-southwest of Baja California, slowly moving westward, and forming a low-pressure area the next day.[32] This system gradually organized in favorable conditions, and at 09:00 UTC on August 13, the system developed into a tropical depression, being designated Ten-E.[33] The system remained relatively unchanged for the next three days as it was affected by moderately strong shear that inhibited intensification but allowed the system to remain tropical. The depression finally became post-tropical at 21:00 UTC on August 16.[34] On August 21, Ten-E again entered a favorable environment for development as its remnants continued southwest, and was briefly monitored by the Central Pacific Hurricane Center for possible redevelopment. Despite this, the storm failed to regenerate and it was last mentioned on August 23.[35]
Tropical Storm Fausto
| Tropical storm (SSHWS) | |
  | |
| Duration | August 16 – August 17 |
|---|---|
| Peak intensity | 40 mph (65 km/h) (1-min) 1004 mbar (hPa) |
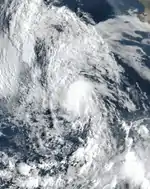
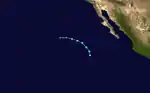
An elongated region of low pressure over the central portion of the basin spawned 2 areas of disturbed weather between the Revillagigedo Islands on August 14.[36] The southwestern portion of this trough slowly moved northwards and became more organized while the northeastern section struggled to become more defined over the day.[36] Despite remaining in favorable conditions, the northeastern disturbance failed to develop and was subsequently absorbed into the southwestern disturbance.[37] This system quickly became sufficiently organized enough to be declared a tropical depression by 03:00 UTC on August 16.[38] Initially not forecast to become a tropical storm, the depression quickly developed a central region of thunderstorms and satellite estimates further indicated the storm had become Tropical Storm Fausto just 12 hours later.[39] However, Fausto quickly succumbed to cooling sea surface temperatures and thunderstorm activity near the center began to decrease.[40] Fausto then weakened to a tropical depression at 03:00 UTC August 17 as it continued northwest, moving over cooler water.[41] Fausto degenerated into a remnant low later that day.[42]
A large plume of moisture brought northwards by Fausto generated massive thunderstorms across a large portion of Northern California, beginning on August 16.[43] These storms produced mostly dry lightning with little to no rain, with almost 11,000 lightning strikes occurring in the state between August 16 and 17. The lightning from these storms sparked 367[44] fires across the state, several of which became very large in a short period of time, threatening thousands of structures and forcing thousands of people to evacuate.[45] The massive SCU Lightning Complex, August Complex, CZU Lightning Complex, and North Complex fires were connected to the thunderstorms associated with Fausto.[46]
Hurricane Genevieve
| Category 4 hurricane (SSHWS) | |
  | |
| Duration | August 16 – August 21 |
|---|---|
| Peak intensity | 130 mph (215 km/h) (1-min) 950 mbar (hPa) |
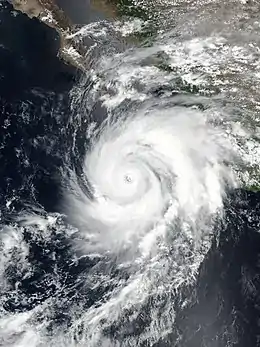
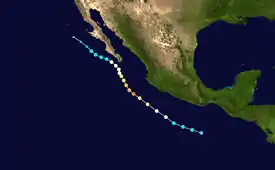
On August 10, a disturbance formed west of Central America and began to be monitored by the NHC.[47] On August 13, this disturbance developed into a trough of low pressure southwest of Mexico.[48] The disturbance gradually organized, and on August 16, the system became a tropical depression, receiving the designation Twelve-E at 15:00 UTC.[49] The depression rapidly strengthened and became a tropical storm 6 hours later at 21:00 UTC, receiving the name Genevieve.[50] Genevieve continued to strengthen rapidly overnight and became a hurricane on August 17.[51] Genevieve continued to intensify quickly, and on the next day, at 09:00 UTC, Genevieve explosively intensified into a Category 3 major hurricane.[52] Three hours later, Genevieve intensified further into a Category 4 hurricane, and formed a very well-defined and clear eye.[53][54] Afterward, Genevieve gradually began to weaken, dropping to Category 3 status by 03:00 UTC on August 19, possibly due to encountering colder water from the cold wake left behind by Hurricane Elida.[55] Genevieve continued a gradual weakening trend for the next several hours,[56] but later that day, data from an NHC Reconnaissance Flight indicated that Genevieve was rapidly weakening, with the storm dropping to Category 1 status by 21:00 UTC that day.[57] On August 20, Genevieve turned northwestward and passed very close to Cabo San Lucas, at the southern tip of the Baja California Peninsula, and the system weakened further into a tropical storm at 18:00 UTC.[58] By 21:00 UTC on August 21, Genevieve had degenerated into a post-tropical cyclone, after having no deep convection for 12 hours.[59]
Numerous tropical cyclone watches and warnings were issued for parts of Baja California beginning on August 17.[60][61] A total of 6 people died in storm-related incidents across Mexico.[62]
Tropical Storm Hernan
| Tropical storm (SSHWS) | |
  | |
| Duration | August 26 – August 28 |
|---|---|
| Peak intensity | 45 mph (75 km/h) (1-min) 1001 mbar (hPa) |
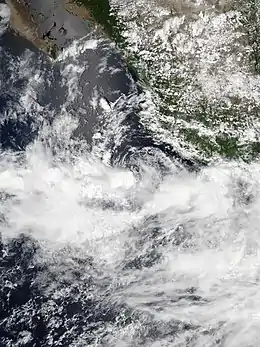
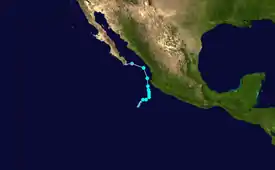
On August 17, the NHC began tracking a disturbance off the west coast of Mexico.[63] Late on August 20, this disturbance formed a broad area of low pressure just southwest of extreme southwestern Mexico.[64] Over the course of the next five days, the system slowly organized, and at 09:00 UTC on August 26, it developed into Tropical Depression Thirteen-E.[65] At 21:00 UTC, the system strengthened into a tropical storm, receiving the name Hernan.[66] A poorly organized storm, the system struggled to intensify in the high-shear environment within a larger scale region of monsoonal rotation.[67] Despite unfavorable conditions, scatterometer data found Hernan had slightly intensified to 45 miles per hour (72 km/h) by 03:00 UTC on August 27.[68] Hernan's peak intensity proved to be short lived as it turned west and moved into the Gulf of California, degenerating into a remnant low over Baja California Sur at 15:00 UTC, August 28.[69]
In Mexico, 97,000 customers lost electricity.[70] Hernan dropped precipitation amounts of 5-9 inches (127–228 mm) of rainfall from Michoacán to Nayarit,[71] causing flash flooding and mudslides in the Mexican states of Jalisco and Colima. It prompted many families to flee their homes.[72] At least 400 people were evacuated in Jalisco,[73] and 18 people stuck on their roof in the state had to be rescued.[74] In Cihuatlán, roughly 365 residents evacuated into shelters.[75] A sinkhole shut down a portion of Mexican Federal Highway 80 between Santa Cruz and San Patricio, a mudslide closed down another part of the freeway near Lázaro Cárdenas. The Cuixmala River overflowed its banks, causing parts of Mexican Federal Highway 200 to shut down. The town of La Manzanilla was mostly inundated by floodwaters which caused a bridge near the town to collapse.[76] Several schools were damaged by Hernan in the state of Colima.[77] In Tamala, a parota tree fell on a road, blocking traffic.[78] In Manzanillo, some homes and streets were damaged and covered with mud.[79] In Nayarit, a mudslide occurred on a hill behind a populated neighborhood in Xalisco, however, no damage has been reported from this incident.[80] Despite Hernan weakening into a tropical depression before landfall in Baja California Sur, local weather services in the area advised residents to take extreme precautions.[81]
Tropical Storm Iselle
| Tropical storm (SSHWS) | |
  | |
| Duration | August 26 – August 30 |
|---|---|
| Peak intensity | 60 mph (95 km/h) (1-min) 997 mbar (hPa) |
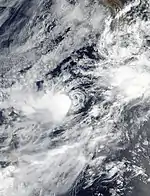
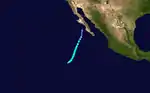
Late on August 24, a small low pressure system developed several hundred miles southwest of the southern tip of the Baja California peninsula, near the disturbance that would later become Tropical Storm Hernan.[82] As environmental conditions for development became more favorable, the circulation of the system gradually became better defined, and the system developed into Tropical Depression Fourteen-E at 15:00 UTC on August 26 over the open Pacific Ocean.[83] The cyclone reached tropical storm strength 6 hours later at 21:00 UTC, receiving the name Iselle.[84] Similarly to Tropical Storm Hernan, Iselle was trapped within a large-scale region of rotation and struggled to organize due to wind shear.[85] However, despite the moderate to strong wind shear, Iselle strengthened to 50 miles per hour (80 km/h) over the next 12 hours while moving slowly northeastward.[86] Iselle continued to intensify and at 15:00 UTC on August 28, Iselle attained its peak intensity of maximum sustained winds of 60 miles per hour (97 km/h) and a minimum central pressure of 997 mbar.[87] Iselle then made a very close pass to Clarion Island, where tropical-storm force winds were reported, before weakening thereafter.[88] Iselle became post-tropical later on August 30 as it headed north, near the Baja California Peninsula.[89]
Tropical Storm Julio
| Tropical storm (SSHWS) | |
  | |
| Duration | September 5 – September 7 |
|---|---|
| Peak intensity | 45 mph (75 km/h) (1-min) 1004 mbar (hPa) |
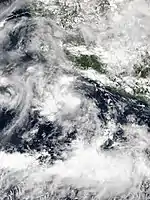
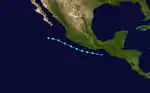
On September 4, the mid-level remnants of Hurricane Nana from the North Atlantic emerged over the Gulf of Tehuantepec and subsequently began to organize, developing a new surface low.[90] By September 5, well-defined and compact surface circulation developed with the surface low, and eventually, the system's thunderstorm activity became organized enough for the system to be dubbed Tropical Storm Julio later that day, as the storm was already producing gale-force winds.[91] A very small cyclone with tropical-storm force winds only extending 35 miles (56 km) from the center,[92] Julio slowly intensified due to a favorable environment.[93] Switching to a quick pace west-northwestward, the storm quickly weakened on September 6 despite forecasts of strengthening.[94] Julio later opened up into a trough of low pressure and became a post-tropical low on 09:00 UTC, September 7.[95][96]
Tropical Storm Karina
| Tropical storm (SSHWS) | |
  | |
| Duration | September 12 – September 16 |
|---|---|
| Peak intensity | 60 mph (95 km/h) (1-min) 996 mbar (hPa) |
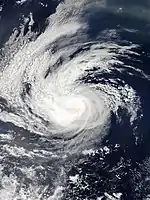
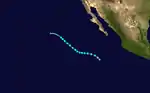
On September 9, the NHC began monitoring an area of disturbed weather to the south of Mexico.[97] Early the next day, a broad area of low pressure formed within the system as it continued to produce disturbed weather.[98] By 03:00 UTC on September 13, the disturbance became organized enough to be designated as a tropical depression.[99] Just six hours later, the depression strengthened into Tropical Storm Karina while located 455 miles southwest of Baja California.[100] Karina slowly strengthened over the next couple of days, reaching its peak intensity around 09:00 UTC on September 15.[101] Karina then weakened below tropical storm status late on September 16 before degenerating into a post-tropical cyclone by 09:00 UTC the next day.[102][103]
Tropical Storm Lowell
| Tropical storm (SSHWS) | |
  | |
| Duration | September 20 – September 25 |
|---|---|
| Peak intensity | 50 mph (85 km/h) (1-min) 1001 mbar (hPa) |
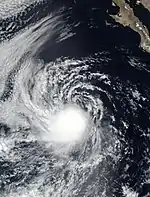
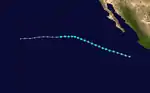
On September 19, the NHC began monitoring an area of disturbed weather south of Mexico for potential tropical cyclogenesis.[104] At 18:00 UTC on September 20, the disturbance gained sufficient organization to be designated a tropical depression. 24 hours later, the depression strengthened into Tropical Storm Lowell. Slowly strengthening, Lowell reached its peak intensity at 06:00 UTC on September 23 with maximum sustained winds of 50 miles per hour (80 km/h) and a barometric pressure of 1001 millibars. Lowell remained poorly organized as it passed close to Clarion Island later that day. Lowell gradually weakened once turning westward on September 24 as it moved into cooler waters and vertical wind shear increased. At 18:00 UTC on September 25, Lowell degenerated into a post-tropical cyclone after lacking deep convection for several hours.[105]
Hurricane Marie
| Category 4 hurricane (SSHWS) | |
  | |
| Duration | September 29 – October 6 |
|---|---|
| Peak intensity | 140 mph (220 km/h) (1-min) 945 mbar (hPa) |
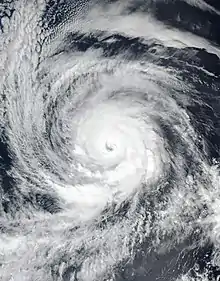
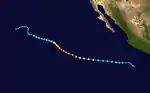
On September 24, the NHC first noted the possibity of tropical cyclogenesis offshore Mexico.[106] Three days later, an area of low pressure formed.[107] Over the next two days, the disturbance rapidly organized as it moved west-northwestward, and at 09:00 UTC on September 29, the system became sufficiently organized to be classified as Tropical Depression Eighteen-E.[108] Just 12 hours later, the depression became Tropical Storm Marie. On September 30, Marie underwent rapid intensification and became a hurricane by 21:00 UTC.[109] Further intensification occurred and 12 hours later, Marie became a Category 2 hurricane.[110] Continuing to intensify, Marie intensified to a Category 3 major hurricane at 03:00 UTC on October 2 before it reached its peak strength as a Category 4 hurricane six hours later with winds of 140 mph (220 km/h) and a pressure of 945 mb (hPa; 27.97 inHg) [111] Marie maintained its strength for a day or so before it began to rapidly weaken due to cooler waters and dry air intrusion.[112] It dropped below major hurricane status at 09:00 UTC on October 4 and below hurricane status at 03:00 UTC on October 5.[113][114] It center became exposed, although the weakening trend slowed as convection continued to fire on its northeast side.[115] After a brief resurgence late on October 5, Marie convection's became too weak and too far from its center for it to remain a tropical cyclone, so it was downgraded to a remnant low at 03:00 UTC on October 7.[116][117]
Tropical Storm Norbert
| Tropical storm (SSHWS) | |
  | |
| Duration | October 5 – October 14 |
|---|---|
| Peak intensity | 60 mph (95 km/h) (1-min) 1000 mbar (hPa) |
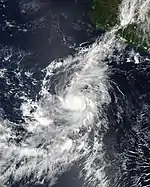
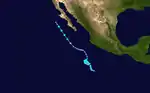
Early on September 30, the NHC began noting the possibility of an area of low pressure forming southwest of Mexico.[118] The area of low pressure finally formed early on October 4 and quickly organized into a tropical depression by 21:00 UTC the next day.[119][120] At 09:00 UTC on October 6, the depression strengthened into Tropical Storm Norbert.[121] After spending 36 hours at tropical storm strength, Nobert weakened back into a tropical depression at 21:00 UTC on October 7. Norbert maintained its status as a tropical depression until it degenerated into a remnant low early on October 10.[122] After Norbert degenerated into a remnant low, the NHC began tracking the low for possible redevelopment, as upper-level winds were expected to become more favorable.[123] The remnants began showing signs of organization over the next two days.[124] On October 13, the low began to quickly organize,[125] and at 21:00 UTC that day, the NHC declared that Norbert had regenerated into a tropical depression several hundred miles southwest of the Baja California peninsula.[126] Soon afterwards, it unexpectedly strengthened into a tropical storm again at 03:00 UTC on October 14.[127] However, this restrengthening was short-lived, as Norbert began weakening again and became a tropical depression 18 hours later.[128] It eventually became post-tropical yet again at 09:00 UTC on October 15 due to unfavorable conditions.[129]
Tropical Storm Odalys
| Tropical storm (SSHWS) | |
  | |
| Duration | November 3 – November 5 |
|---|---|
| Peak intensity | 50 mph (85 km/h) (1-min) 1000 mbar (hPa) |
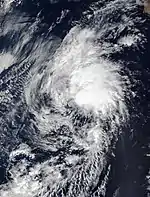
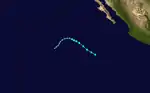
A tropical wave passed over Central America and entered the Eastern Pacific basin on October 29. Its associated thunderstorm activity remained relatively disorganized until November 1, when a broad area of low pressure developed within the system. Spiral rainbands became more pronounced the next day, and by November 3 the system was producing tropical-storm-force winds of 40 mph (65 km/h). At 18:00 UTC, the NHC determined the system was sufficiently organized to be designated Tropical Storm Odalys, while it was centered about 730 mi (1,175 km) southwest of the southern tip of the Baja California Peninsula. Odalys intensified somewhat over the next days while moving west-northwest despite a generally hostile environment, with strong wind shear and dry air impinging on the system. At 00:00 UTC on November 5, Odalys reached its peak intensity with winds of 50 mph (85 km/h) and a central pressure of 1000 mbar (hPa; 29.53 inHg). Wind shear increased further shortly afterwards, causing Odalys to weaken quickly and eventually become a post-tropical cyclone at 18:00 UTC on November 5 as it became devoid of significant thunderstorm activity. The shallow remnants of Odalys turned southwest under the influence of a strong high-pressure area and dissipated by November 8.[130]
Tropical Storm Polo
| Tropical storm (SSHWS) | |
  | |
| Duration | November 17 – November 19 |
|---|---|
| Peak intensity | 45 mph (75 km/h) (1-min) 1004 mbar (hPa) |
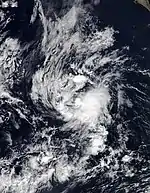
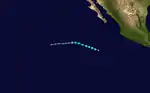
The season's final storm developed from an area of convection within the monsoon trough that may have been enhanced by a Gulf of Tehuantepec gap wind event over preceding days. On November 14, a broad area of low pressure formed. Both the low and associated thunderstorm activity gained cohesion over the coming days, resulting in the formation of a tropical depression around 18:00 UTC on November 17 to the southwest of Baja California Sur. The depression intensified into Tropical Storm Polo six hours later and reached peak winds of 45 mph (75 km/h) the following morning. As the system moved west-northwest, it encountered an increasingly hostile environment, and Polo weakened to a tropical depression early on November 19. By 18:00 UTC that day, the cyclone degenerated to a remnant area of low pressure that moved west and then west-southwest prior to dissipating into an open trough on November 21.[131]
Storm names
The following names were used for named storms that formed in the northeastern Pacific Ocean during 2020. This is the same list used in the 2014 season, with the exception of the name Odalys, which replaced Odile. The name Odalys was used for the first time this year. No names were retired from this list, so all will be used again in the 2026 season.[132]
|
|
For storms that form in the Central Pacific Hurricane Center's area of responsibility, encompassing the area between 140 degrees west and the International Date Line, all names are used in a series of four rotating lists.[133] The next four names that were slated for use in 2020 are shown below. However, none of them were used.
|
|
|
|
Season effects
This is a table of all the storms that formed in the 2020 Pacific hurricane season. It includes their duration, names, landfall(s), denoted in parentheses, damages, and death totals. Deaths in parentheses are additional and indirect (an example of an indirect death would be a traffic accident), but were still related to that storm. Damage and deaths include totals while the storm was extratropical, a tropical wave, or a low, and all the damage figures are in 2020 USD.
| Saffir–Simpson scale | ||||||
| TD | TS | C1 | C2 | C3 | C4 | C5 |
| Storm name |
Dates active | Storm category
at peak intensity |
Max 1-min wind mph (km/h) |
Min. press. (mbar) |
Areas affected | Damage (USD) |
Deaths | Ref(s) | ||
|---|---|---|---|---|---|---|---|---|---|---|
| One-E | April 25 – 26 | Tropical depression | 35 (55) | 1006 | None | None | None | |||
| Amanda | May 30 – 31 | Tropical storm | 40 (65) | 1003 | Guatemala, El Salvador, Honduras, Belize, Costa Rica, Southern Mexico, Yucatán Peninsula | ≥$200 million | 40 | |||
| Boris | June 24 – 27 | Tropical storm | 40 (65) | 1005 | None | None | None | |||
| Four-E | June 29 – 30 | Tropical depression | 30 (45) | 1006 | None | None | None | |||
| Cristina | July 6 – 12 | Tropical storm | 70 (110) | 993 | Socorro Island | None | None | |||
| Six-E | July 13 – 14 | Tropical depression | 35 (55) | 1007 | Central America | None | None | |||
| Seven-E | July 20 – 21 | Tropical storm | 40 (65) | 1006 | None | None | None | |||
| Douglas | July 20 – 28 | Category 4 hurricane | 130 (215) | 954 | Hawaii | Minimal | None | |||
| Elida | August 8 – 12 | Category 2 hurricane | 105 (165) | 971 | Southwestern Mexico, Socorro Island | None | None | |||
| Ten-E | August 13 – 16 | Tropical depression | 35 (55) | 1004 | None | None | None | |||
| Fausto | August 16 – 17 | Tropical storm | 40 (65) | 1004 | Northern California | None | None | |||
| Genevieve | August 16 – 21 | Category 4 hurricane | 130 (215) | 950 | Southwestern Mexico, Socorro Island, Baja California Peninsula, Southern California | $50 million | 6 | |||
| Hernan | August 26 – 28 | Tropical storm | 45 (75) | 1001 | Mexico, Baja California Peninsula | Unknown | 1 | |||
| Iselle | August 26 – 30 | Tropical storm | 60 (95) | 997 | Clarion Island | None | None | |||
| Julio | September 5 – 7 | Tropical storm | 45 (75) | 1004 | Southwestern Mexico | None | None | |||
| Karina | September 12 – 16 | Tropical storm | 60 (95) | 996 | None | None | None | |||
| Lowell | September 20 – 25 | Tropical storm | 50 (85) | 1001 | Clarion Island | None | None | |||
| Marie | September 29 – October 6 | Category 4 hurricane | 140 (220) | 945 | None | None | None | |||
| Norbert | October 5 – 14 | Tropical storm | 60 (95) | 1000 | None | None | None | |||
| Odalys | November 3 – 5 | Tropical storm | 50 (85) | 1000 | None | None | None | |||
| Polo | November 17 – 19 | Tropical storm | 45 (75) | 1004 | None | None | None | |||
| Season aggregates | ||||||||||
| 21 systems | April 25 – November 19 | 140 (220) | 945 | ≥$250 million | 47 | |||||
See also
 Tropical cyclones portal
- Tropical cyclones in 2020
- List of Pacific hurricanes
- Pacific hurricane season
- 2020 Atlantic hurricane season
- 2020 Pacific typhoon season
- 2020 North Indian Ocean cyclone season
- South-West Indian Ocean cyclone seasons: 2019–20, 2020–21
- Australian region cyclone seasons: 2019–20, 2020–21
- South Pacific cyclone seasons: 2019–20, 2020–21
Notes
- The totals represent the sum of the squares for every (sub)tropical storm's intensity of over 33 knots (38 mph, 61 km/h), divided by 10,000. Calculations are provided at Talk:2020 Pacific hurricane season/ACE calcs.
References
- "Background Information: East Pacific Hurricane Season". Climate Prediction Center. College Park, Maryland: National Oceanic and Atmospheric Administration. May 22, 2014. Retrieved May 29, 2014.
- National Hurricane Center; Hurricane Research Division; Central Pacific Hurricane Center. "The Northeast and North Central Pacific hurricane database 1949–2019". United States National Oceanic and Atmospheric Administration's National Weather Service. Retrieved 1 October 2020. A guide on how to read the database is available here.
- "Pronóstico de Ciclones Tropicales 2020". smn.cna.gob.mx. Archived from the original on 2020-06-02. Retrieved 2020-05-20.
- "NOAA 2020 Eastern Pacific Hurricane Season Outlook". Climate Prediction Center. May 21, 2020. Archived from the original on May 28, 2020. Retrieved May 21, 2020.
- Dorst Neal. When is hurricane season? (Report). Atlantic Oceanographic and Meteorological Laboratory. Archived from the original on 6 December 2010.
- Mersereau, Dennis (April 25, 2020). "The Eastern Pacific Ocean Just Saw Its Earliest Tropical Cyclone On Record". Forbes. Retrieved May 2, 2020.
- "First April Tropical Depression on Record Formed in the Eastern Pacific Ocean Well South of Baja California (RECAP)". The Weather Channel. Retrieved 2020-06-30.
- "Amanda forms and clashes with a tropical wave in Yucatán". Yucatán Expat Life. 2020-05-31. Retrieved 2020-06-30.
- "Tropical depression/storm Amanda impact in El Salvador: Humanitarian Situation Report No. 1 (Reporting Period: 31 May - 10 June 2020) - El Salvador". ReliefWeb. Retrieved 2020-06-30.
- "Tropical Storm Boris Forms Over Pacific, Expected To Be Short Lived". bigislandvideonews.com. Retrieved 2020-06-30.
- "Boris Weakens To Tropical Depression". bigislandvideonews.com. Retrieved 2020-06-30.
- "Tropical depression forms in eastern Pacific". AccuWeather. June 30, 2020.
- "Cristina poised to become first hurricane of 2020". wusa9.com. Retrieved 2020-07-17.
- "Window Closing for Cristina to Become Seasons 1st Hurricane". CBN News. 2020-07-12. Retrieved 2020-07-17.
- "06E – Eastern Pacific Ocean – Hurricane And Typhoon Updates". blogs.nasa.gov. Retrieved 2020-07-17.
- "Hurricane Douglas Discussion 9". nhc.noaa.gov. Retrieved 2020-07-22.
- John P. Cangialosi (June 30, 2020). Tropical Cyclone Report: Tropical Depression One-E (PDF) (Report). Miami, Florida: National Hurricane Center. Retrieved November 2, 2020.
- Robbie Berg (September 10, 2020). Tropical Cyclone Report: Tropical Storm Amanda (PDF) (Report). Miami, Florida: National Hurricane Center. Retrieved November 2, 2020.
- "La tormenta tropical Amanda provoca inundaciones y el desbordamiento de ríos en El Salvador". Noticias de El Salvador – elsalvador.com (in Spanish). 2020-05-31. Retrieved 2020-05-31.
- "More than a dozen people killed after tropical storm Amanda lashes El Salvador, Guatemala". France 24. June 1, 2020. Retrieved June 1, 2020.
- "Alerta Roja por lluvias: Tormenta tropical Amanda deja al menos siete fallecidos y severas inundaciones en El Salvador". Noticias de El Salvador – La Prensa Gráfica | Informate con la verdad (in Spanish). Retrieved 2020-05-31.
- "Hurricane Amanda kills 14 people in El Salvador". Seven News. June 1, 2020. Retrieved June 1, 2020.
- "Deadly Tropical Storm Amanda hits El Salvador, Guatemala". Channel NewsAsia. Agence France-Presse. June 1, 2020. Retrieved June 1, 2020.
- Eric S. Blake (January 13, 2021). Tropical Cyclone Report: Tropical Storm Boris (PDF) (Report). Miami, Florida: National Hurricane Center. Retrieved October 6, 2021.
- Richard J. Pasch (March 15, 2021). Tropical Cyclone Report: Tropical Depression Four-E (PDF) (Report). Miami, Florida: National Hurricane Center. Retrieved October 7, 2021.
- Jack Beven and Christopher Landsea (November 13, 2020). Tropical Storm Cristina (EP052020) (PDF) (Report). Tropical Cyclone Report. National Hurricane Center. Retrieved November 23, 2020.
- Stacy R. Stewart (December 20, 2020). Tropical Cyclone Report: Tropical Depression Six-E (PDF) (Report). Miami, Florida: National Hurricane Center. Retrieved October 8, 2021.
- Brown, Daniel (December 11, 2020). "Unnamed Tropical Storm (Formerly Tropical Depression Seven-E) (EP072020)" (PDF). Tropical Cyclone Report. National Hurricane Center.
- Andy Latto (November 21, 2020). Hurricane Douglas (EP082020) (PDF) (Report). Tropical Cyclone Report. National Hurricane Center. Retrieved December 1, 2020.
- Ron Brackett (July 27, 2020). "Hurricane Douglas Blows by Hawaii, Leaving Little Damage Behind". The Weather Channel. Retrieved December 1, 2020.
- John P. Cangialosi (October 24, 2020). Tropical Cyclone Report: Hurricane Elida (PDF) (Report). Miami, Florida: National Hurricane Center. Retrieved October 8, 2021.
- John Cangialosi (August 10, 2020). "Five-Day Graphical Tropical Weather Outlook". www.nhc.noaa.gov. Miami, Florida: National Hurricane Center. Retrieved August 13, 2020.
- Andrew Latto (August 13, 2020). "Tropical Depression Ten-E Public Advisory Number 1". www.nhc.noaa.gov. Miami, Florida: National Hurricane Center. Retrieved August 13, 2020.
- Andrew Latto (August 16, 2020). "Post-Tropical Cyclone Ten-E Public Advisory Number 15". www.nhc.noaa.gov. Miami, Florida: National Hurricane Center. Retrieved August 16, 2020.
- "NHC Graphical Outlook Archive". www.nhc.noaa.gov. Retrieved 2020-08-24.
- "NHC Graphical Outlook Archive". www.nhc.noaa.gov. Retrieved 2020-08-16.
- "NHC Graphical Outlook Archive". www.nhc.noaa.gov. Retrieved 2020-08-16.
- "Tropical Depression ELEVEN-E Forecast Discussion Number 1". www.nhc.noaa.gov. Retrieved 2020-08-16.
- "Tropical Storm FAUSTO Forecast Discussion Number 3". www.nhc.noaa.gov. Retrieved 2020-08-16.
- "Tropical Storm FAUSTO Forecast Discussion Number 4". www.nhc.noaa.gov. Retrieved 2020-08-16.
- "Tropical Depression FAUSTO Forecast Discussion Number 5". www.nhc.noaa.gov. Retrieved 2020-08-17.
- "Post-Tropical Cyclone Fausto Public Advisory Number 7". www.nhc.noaa.gov. Retrieved 2020-08-17.
- "Wondering where this moisture is coming from bringing us these thunderstorms? Check out this GOES-17 infrared imagery and follow the moisture back to Tropical Storm Fausto". Twitter. August 16, 2020. Retrieved August 16, 2020.
- "Cal Fire 72 hour activity". twitter.com. Retrieved 2020-08-20.
- "Moisture from Tropical Storm Fausto fuels NorCal thunderstorms". KTLA. 2020-08-16. Retrieved 2020-08-16.
- [California Event Report: Wildfire] (Report). National Centers for Environmental Information. National Weather Service Forecast Office in Sacramento, California. 2020. Retrieved January 12, 2021.
- John Cangialosi (August 10, 2020). "Five-Day Graphical Tropical Weather Outlook". www.nhc.noaa.gov. Miami, Florida: National Hurricane Center. Retrieved August 16, 2020.
- Robbie Berg (August 13, 2020). "Five-Day Graphical Tropical Weather Outlook". www.nhc.noaa.gov. Miami, Florida: National Hurricane Center. Retrieved August 16, 2020.
- Dan Brown (August 16, 2020). "Tropical Depression Twelve-E Public Advisory Number 1". www.nhc.noaa.gov. Miami, Florida: National Hurricane Center. Retrieved August 16, 2020.
- Dan Brown (August 16, 2020). "Tropical Storm Genevieve Public Advisory Number 2". www.nhc.noaa.gov. Miami, Florida: National Hurricane Center. Retrieved August 16, 2020.
- Andrew Latto (August 17, 2020). "Tropical Storm Genevieve Discussion Number 5". www.nhc.noaa.gov. Miami, Florida: National Hurricane Center. Retrieved August 17, 2020.
- Jack Beven (August 18, 2020). "Hurricane Genevieve Discussion Number 8". www.nhc.noaa.gov. Miami, Florida: National Hurricane Center. Retrieved August 18, 2020.
- David Zelinsky (August 18, 2020). "Hurricane Genevieve Intermediate Advisory Number 8A". www.nhc.noaa.gov. Miami, Florida: National Hurricane Center. Retrieved August 18, 2020.
- David Zelinsky (August 18, 2020). "Hurricane Genevieve Discussion Number 9". www.nhc.noaa.gov. Miami, Florida: National Hurricane Center. Retrieved August 18, 2020.
- Eric S. Blake (August 19, 2020). "Hurricane Genevieve Discussion Number 11". www.nhc.noaa.gov. Miami, Florida: National Hurricane Center. Retrieved August 19, 2020.
- Daniel Brown (August 19, 2020). "Hurricane Genevieve Duscussion Number 13". www.nhc.noaa.gov. Miami, Florida: National Hurricane Center. Retrieved August 20, 2020.
- Daniel Brown (August 19, 2020). "Hurricane Genevieve Discussion Number 14". www.nhc.noaa.gov. Miami, Florida: National Hurricane Center. Retrieved August 20, 2020.
- Andrew Latto (August 20, 2020). "Tropical Storm Genevieve Intermediate Advisory Number 17A". www.nhc.noaa.gov. Miami, Florida: National Hurricane Center. Retrieved August 20, 2020.
- Daniel Brown (August 21, 2020). "Post-Tropical Cyclone Genevieve Discussion Number 22". www.nhc.noaa.gov. Miami, Florida: National Hurricane Center. Retrieved August 22, 2020.
- Dan Brown (August 17, 2020). "Hurricane Genevieve Public Advisory Number 6". www.nhc.noaa.gov. Miami, Florida: National Hurricane Center. Retrieved August 18, 2020.
- John Cangialosi (August 18, 2020). "Hurricane Genevieve Advisory Number 10". www.nhc.noaa.gov. Miami, Florida: National Hurricane Center. Retrieved August 18, 2020.
- "Tormenta tropical "Julio" provoca fuertes lluvias en Nayarit, Jalisco y Michoacán". El Universal (in Spanish). September 6, 2020. Retrieved September 8, 2020.
- Andrew Latto (August 17, 2020). "Five-Day Graphical Tropical Weather Outlook". www.nhc.noaa.gov. Miami, Florida: National Hurricane Center. Retrieved August 26, 2020.
- Dave Roberts (August 20, 2020). "Five-Day Graphical Tropical Weather Outlook". www.nhc.noaa.gov. Miami, Florida: National Hurricane Center. Retrieved August 26, 2020.
- Stacy Stewart (August 26, 2020). "Tropical Depression Thirteen-E Public Advisory Number 1". www.nhc.noaa.gov. Miami, Florida: National Hurricane Center. Retrieved August 26, 2020.
- Andrew Latto (August 26, 2020). "Tropical Storm Hernan Public Advisory Number 3". www.nhc.noaa.gov. Miami, Florida: National Hurricane Center. Retrieved August 26, 2020.
- Stacy Stewart (August 26, 2020). "Tropical Storm Hernan Discussion Number 4". www.nhc.noaa.gov. Miami, Florida: National Hurricane Center. Retrieved August 27, 2020.
- Stacy Stewart (August 27, 2020). "Tropical Storm Hernan Discussion Number 5". www.nhc.noaa.gov. Miami, Florida: National Hurricane Center. Retrieved August 27, 2020.
- "Post-Tropical Cyclone HERNAN Forecast Discussion Number 11". www.nhc.noaa.gov. Retrieved 2020-08-28.
- "Tormenta Tropical "Hernán" dejó sin luz a 97 mil usuarios de CFE". News Report MX. Retrieved August 29, 2020.
- Lolas, Jose (August 29, 2020). "Tormenta tropical Hernán deja lluvias en seis estados mexicanos". La Primera (in Spanish). Retrieved October 12, 2020.
- "Evacuations in Colima and Jalisco in wake of Tropical Storm Hernan". Mexico News Daily. August 28, 2020. Retrieved August 28, 2020.
- "Evacuan a 400 personas por tormenta tropical "Hernán" en Jalisco". El Universal (in Spanish). 2020-08-28. Retrieved 2020-08-28.
- de 2020, Por Newsroom Infobae28 de Agosto. "Tormenta tropical Hernan deja inundaciones y daños en costa oeste mexicana". infobae (in Spanish). Retrieved 2020-08-28.
- Brenda Beltrán. "Tormenta tropical "Hernán" dejó las costas de Jalisco". Tribuna De La Bahia. Retrieved August 29, 2020.
- "Evacuations in Colima and Jalisco in wake of Tropical Storm Hernán". Mexico News Daily. Retrieved August 29, 2020.
- "Escuelas de Colima, sin daños considerables por Tormenta Tropical 'Hernán'". Colimanoticias. August 29, 2020. Retrieved September 4, 2020.
- "Causa 'Hernán' caída de Parota y obstrucción de carretera en Ixtlahuacán". Colimanoticias. August 27, 2020. Retrieved September 4, 2020.
- Norma Osiris Moreno (August 28, 2020). "Manzanillo después de la Tormenta Tropical 'Hernán'". Retrieved September 4, 2020.
- "The tropical storm Hernán leaves damage and lands in Baja California Sur". NewsBeezer. August 28, 2020. Retrieved September 4, 2020.
- "Hernan decrece a depresión en el Pacífico pero golpeará a Baja California Sur". Hola News. August 28, 2020. Retrieved September 4, 2020.
- Stacy Stewart (August 24, 2020). "Five-Day Graphical Tropical Weather Outlook". www.nhc.noaa.gov. Miami, Florida: National Hurricane Center. Retrieved August 26, 2020.
- Dave Roberts (August 26, 2020). "Tropical Depression Thirteen-E Public Advisory Number 1". www.nhc.noaa.gov. Miami, Florida: National Hurricane Center. Retrieved August 26, 2020.
- Andrew Latto (August 26, 2020). "Tropical Storm Iselle Public Advisory Number 2". www.nhc.noaa.gov. Miami, Florida: National Hurricane Center. Retrieved August 26, 2020.
- Stacy Stewart (August 27, 2020). "Tropical Storm Iselle Discussion Number 4". www.nhc.noaa.gov. Miami, Florida: National Hurricane Center. Retrieved August 27, 2020.
- Andrew Latto (August 27, 2020). "Tropical Storm Iselle Discussion Number 6". www.nhc.noaa.gov. Miami, Florida: National Hurricane Center. Retrieved August 27, 2020.
- "Tropical Storm ISELLE Forecast Discussion Number 9". www.nhc.noaa.gov. Retrieved 2020-08-28.
- "Tropical Storm ISELLE". www.nhc.noaa.gov. Retrieved 2020-08-28.
- "Post-Tropical Cyclone Iselle Forecast Discussion Number 18". www.nhc.noaa.gov. Retrieved 2020-08-30.
- "NHC Graphical Outlook Archive". www.nhc.noaa.gov. Retrieved 2020-09-07.
- "Tropical Storm JULIO Forecast Discussion Number 1".
- "Tropical Storm JULIO Public Advisory 3". www.nhc.noaa.gov. Retrieved 2020-09-07.
- "Tropical Storm JULIO Forecast Discussion Number 4". www.nhc.noaa.gov. Retrieved 2020-09-07.
- "Tropical Storm JULIO Forecast Discussion Number 6". www.nhc.noaa.gov. Retrieved 2020-09-07.
- "Remnants of JULIO Forecast Discussion Number 7". www.nhc.noaa.gov. Retrieved 2020-09-07.
- Daniel P. Brown (January 21, 2021). Tropical Cyclone Report: Tropical Storm Julio (PDF) (Report). National Hurricane Center. Retrieved March 9, 2021.
- Robbie Berg (September 9, 2020). "Two-Day Graphical Tropical Weather Outlook". www.nhc.noaa.gov. Miami, Florida: National Hurricane Center. Retrieved September 13, 2020.
- Dave Roberts (September 10, 2020). "Two-Day Graphical Tropical Weather Outlook". www.nhc.noaa.gov. Miami, Florida: National Hurricane Center. Retrieved September 13, 2020.
- Eric Blake (September 13, 2020). "Tropical Depression Sixteen-E Discussion Number 1". www.nhc.noaa.gov. Miami, Florida: National Hurricane Center. Retrieved September 13, 2020.
- Jack Beven (September 13, 2020). "Tropical Storm Karina Advisory Number 2". www.nhc.noaa.gov. Miami, Florida: National Hurricane Center. Retrieved September 13, 2020.
- John Cangialosi (September 15, 2020). "Tropical Storm Karina Advisory Number 10". www.nhc.noaa.gov. Miami, Florida: National Hurricane Center. Retrieved September 17, 2020.
- Tom Birchard (September 16, 2020). "Tropical Depression Karina Advisory Number 16". www.nhc.noaa.gov. Miami, Florida: National Hurricane Center. Retrieved September 17, 2020.
- Tom Birchard (September 17, 2020). "Post-Tropical Cyclone Karina Advisory Number 17". www.nhc.noaa.gov. Miami, Florida: National Hurricane Center. Retrieved September 17, 2020.
- Robbie Berg (September 19, 2020). "Two-Day Graphical Tropical Weather Outlook". www.nhc.noaa.gov. Miami, Florida: National Hurricane Center. Retrieved September 23, 2020.
- Cangialosi, John (December 2, 2020). "Tropical Storm Lowell (EP172020)" (PDF). Tropical Cyclone Report. National Hurricane Center. Retrieved December 4, 2020.
- "NHC Graphical Outlook Archive". www.nhc.noaa.gov. Retrieved 2020-09-29.
- "NHC Graphical Outlook Archive". www.nhc.noaa.gov. Retrieved 2020-09-29.
- "Tropical Depression EIGHTEEN-E". www.nhc.noaa.gov. Retrieved 2020-09-29.
- "Hurricane MARIE". www.nhc.noaa.gov. Retrieved 2020-10-01.
- Richard Pasch (October 1, 2020). "Hurricane Marie Public Advisory Number 10". www.nhc.noaa.gov. Retrieved October 2, 2020.
- "Hurricane Marie Public Advisory Number 13". www.nhc.noaa.gov. Retrieved 2020-10-02.
- "Hurricane MARIE". www.nhc.noaa.gov. Retrieved 8 October 2020.
- "Hurricane MARIE". www.nhc.noaa.gov. Retrieved 8 October 2020.
- "Tropical Storm MARIE". www.nhc.noaa.gov. Retrieved 8 October 2020.
- "Tropical Storm MARIE". www.nhc.noaa.gov. Retrieved 8 October 2020.
- "Tropical Storm MARIE". www.nhc.noaa.gov. Retrieved 8 October 2020.
- "Post-Tropical Cyclone MARIE". www.nhc.noaa.gov. Retrieved 8 October 2020.
- "Two-Day Graphical Outlook".
- "Two-Day Graphical Tropical Weather Outlook".
- "Tropical Depression Nineteen-E Advisory Number 1".
- "Tropical Storm Norbert Advisory Number 3".
- "Tropical Storm Norbert Advisory Number 9".
- "Five-Day Graphical Tropical Weather Outlook". www.nhc.noaa.gov. October 10, 2020. Retrieved 2020-10-13.
- "Five-Day Graphic Tropical Weather Outlook". www.nhc.noaa.gov. October 11, 2020. Retrieved 2020-10-13.
- "Five-Day Graphical Tropical Weather Outlook". www.nhc.noaa.gov. October 13, 2020. Retrieved 2020-10-13.
- "Tropical Depression NORBERT". www.nhc.noaa.gov. Retrieved 2020-10-14.
- "Tropical Storm Norbert Public Advisory". www.nhc.noaa.gov. Retrieved 2020-10-14.
- "Tropical Depression Norbert Advisory Number 24".
- "Post-Tropical Cyclone Norbert Public Advisory 26". www.nhc.noaa.gov. Retrieved 2020-10-15.
- Richard J. Pasch (April 13, 2021). Tropical Cyclone Report: Tropical Storm Odalys (PDF) (Report). Miami, Florida: National Hurricane Center. Retrieved April 24, 2021.
- John L. Beven II (March 17, 2021). Tropical Cyclone Report: Tropical Storm Polo (PDF) (Report). Miami, Florida: National Hurricane Center. Retrieved October 9, 2021.
- "Tropical Cyclone Names". National Hurricane Center. National Oceanic and Atmospheric Administration. 2013-04-11. Archived from the original on May 8, 2013. Retrieved May 8, 2013.
- "Pacific Tropical Cyclone Names 2016-2021". Central Pacific Hurricane Center. National Oceanic and Atmospheric Administration. May 12, 2016. Archived from the original (PHP) on December 30, 2016.
External links
 |
Wikimedia Commons has media related to 2020 Pacific hurricane season. |

