2003 Pacific hurricane season
The 2003 Pacific hurricane season was the first season to feature no major hurricanes – storms of Category 3 intensity or higher – since 1977. The season officially started on May 15, 2003, in the eastern Pacific Ocean, and on June 1, 2003, in the central Pacific, and lasted until November 30, 2003.[1] These dates conventionally delimit the period of each year when most tropical cyclones form in the northeastern Pacific Ocean. The season saw 16 tropical storms form, of which 7 became hurricanes, which is about average. Damage across the basin reached $129 million (2003 USD), while 23 people were killed by the various storms.
| 2003 Pacific hurricane season | |
|---|---|
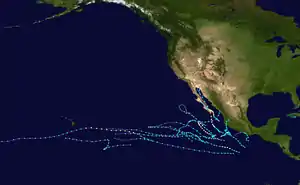 Season summary map | |
| Seasonal boundaries | |
| First system formed | May 19, 2003 |
| Last system dissipated | October 26, 2003 |
| Strongest storm | |
| Name | Nora |
| • Maximum winds | 105 mph (165 km/h) (1-minute sustained) |
| • Lowest pressure | 969 mbar (hPa; 28.61 inHg) |
| Seasonal statistics | |
| Total depressions | 17 |
| Total storms | 16 |
| Hurricanes | 7 |
| Major hurricanes (Cat. 3+) | 0 (tied record low) |
| Total fatalities | 23 total |
| Total damage | $129 million (2003 USD) |
| Related articles | |
Despite the overall lack of activity, the season produced an unusually large number of tropical cyclones which affected Mexico. The most notable cyclones during the year were Hurricanes Ignacio and Marty, which both struck the Baja California Peninsula as hurricanes and killed 2 and 12 people across the country. Three other Pacific storms, two of which were hurricanes, and three Atlantic storms also had a direct impact on Mexico. The only other significant storm of the season was Hurricane Jimena, which passed just to the south of Hawaii, the first storm to directly threaten Hawaii in several years.
Seasonal forecasts
| Region | Date | Tropical storms | Hurricanes | Major hurricanes | Source |
|---|---|---|---|---|---|
| Eastern | Average (1981–2010) | 16 | 9 | 4 | |
| Eastern | June 12, 2003 | 11–15 | 6–9 | 2–5 | [3] |
| Eastern | Actual activity | 16 | 7 | 0 | [4] |
| Central | Average | 4–5 | 1 | – | [5] |
| Central | May 19, 2003 | 2–3 | – | – | [5] |
| Central | Actual activity | 1 | 1 | 0 | [6] |
On June 12, 2003, National Oceanic and Atmospheric Administration (NOAA) published a press release issuing its forecast for the East Pacific hurricane season, the first time it had done so. The scientists predicted a 50% chance of below normal activity and a 40% chance of near normal activity, due to the expectation that La Niña conditions would develop. La Niña conditions generally restrict tropical cyclone development in the northeast Pacific, which is the opposite of its effect in the Atlantic.[3]
On May 19, 2003, NOAA issued a press release that detailed its forecast for the Central Pacific hurricane season. The forecast called for a slightly below-average level of activity in 2003, due to the same forecast of the onset of La Niña which would later prompt the low forecast for the Eastern Pacific.[5]
Seasonal summary
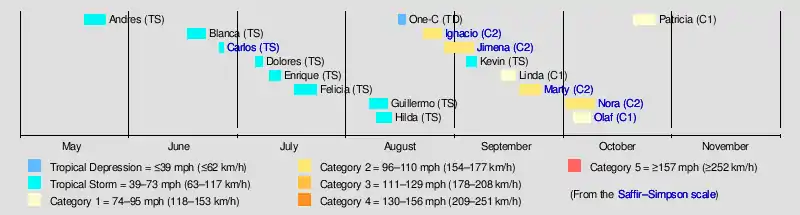
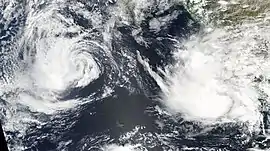
There were 16 named storms and 7 hurricanes during the 2003 Pacific hurricane season, which is comparable with the long-term averages. However, there were no major hurricanes (Category 3 or higher on the Saffir–Simpson hurricane scale); this was the first time this had happened in the eastern Pacific since 1977, and is well below the long-term average of four. The first hurricane, Ignacio, formed on August 24. This is the latest formation of the first hurricane of a season recorded in the east Pacific since reliable satellite observation began in 1966.[7] Additionally, the accumulated cyclone energy (ACE) index for the 2003 Pacific hurricane season was 53.4 units in the Eastern Pacific and 3.3 units in the Central Pacific. This value was within the top 10 least active seasons ever since reliable records began in 1971.[8]
Whilst the total activity was below average, there was an unusually high number of landfalls in Mexico. A total of eight Pacific and North Atlantic tropical cyclones had a direct impact in Mexico in 2003, second only to 1971, when nine did so. This is well above the long-term average of 4.2 Atlantic and east Pacific storms affecting Mexico. Five Pacific storms impacted Mexico, of which Hurricanes Ignacio and Marty both made landfall in the state of Baja California Sur at hurricane intensity.[7] Two other storms hit mainland Mexico as tropical storms and a third as a tropical depression.[7] Three storms hit Mexico within a very short space of time; those being the Pacific hurricanes Nora and Olaf, and the Atlantic Tropical Storm Larry. As a result of the flooding caused by these storms, disaster areas were declared in 14 states.[9]
Activity in the Central Pacific was below average, with only one tropical depression forming in the basin and one hurricane entering the basin from the east Pacific. In addition, a third system, Tropical Storm Guillermo, weakened to a remnant low just to the east of the Central Pacific Hurricane Center's area of responsibility. Although activity was generally low, Hurricane Jimena was the first direct threat to the Hawaiian Islands for several years and a hurricane watch was issued for the island of Hawaii. Jimena passed to the south, but still brought tropical-storm-force gusts and heavy rain to the island.[6]
Systems
Tropical Storm Andres
| Tropical storm (SSHWS) | |
  | |
| Duration | May 19 – May 25 |
|---|---|
| Peak intensity | 60 mph (95 km/h) (1-min) 997 mbar (hPa) |
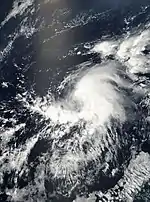
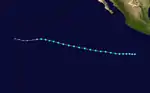
An area of disturbance weather developed south of Guatemala near 10°N on May 10 within a broad area of low pressure. After tracking westward, the disturbance became classifiable by the Dvorak technique on May 18. Following the development of a closed low-level circulation, the disturbance was classified as a tropical depression on May 19 well to the south of Mexico. Moving west, the depression became a tropical storm the next day. Despite increasing wind shear from an anticyclone causing the convection to become displaced from the low-level center, Andres obtained its peak strength with winds of 60 mph (95 km/h) by 1800 UTC on May 20. Increasing shear prevented any further development as the storm moved quickly west-northwest. On May 25, the shear and a reduction in water temperatures induced a weakening trend. Andres was downgraded to a tropical depression on May 25, became a post-tropical cyclone six hours later, and dissipated on the next day. The storm did not approach land.[10]
Tropical Storm Blanca
| Tropical storm (SSHWS) | |
  | |
| Duration | June 17 – June 22 |
|---|---|
| Peak intensity | 60 mph (95 km/h) (1-min) 997 mbar (hPa) |
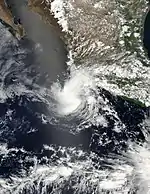
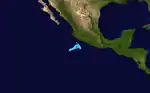
A tropical wave interacted with an area of disturbed weather that had lingered near the southwestern Mexican coast without showing any signs of organization during mid-June. Following an increase in organization, the combined disturbance was classified as a tropical depression early on June 17. The storm strengthened and became Tropical Storm Blanca 12 hours later. The storm moved slowly to the west and based on Dvorak intensity estimates, was believed to have reached its peak on June 18 with 60 mph (95 km/h) winds. Although Blanca never developed a true eye, at its peak there was a ring of convection that resembled one. Under the influence of strong shear from the southeast, Blanca began to weaken and move erratically, although intermittent bursts of deep convection continued. The storm degenerated to a tropical depression on June 20 and a post-tropical cyclone on June 22. The remnant of Blanca were tracked for an additional two days. There were no effects from Blanca on land.[11]
Tropical Storm Carlos
| Tropical storm (SSHWS) | |
  | |
| Duration | June 26 – June 27 |
|---|---|
| Peak intensity | 65 mph (100 km/h) (1-min) 996 mbar (hPa) |
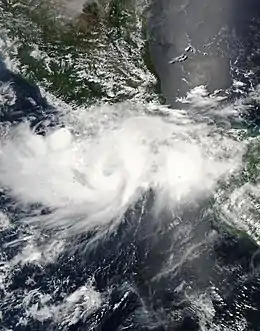
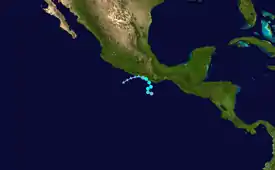
Tropical Storm Carlos formed from a tropical wave that crossed Central America on June 20 from a tropical wave to the south of Mexico. After gradually organizing, the wave was designated a tropical depression on June 26. At noon on that day, the depression was Carlos quickly strengthened, developing a well-defined eye feature in the center of the convection. Based on the presence and location of the eye, it is estimated Carlos made landfall early on June 27 with peak winds of 65 mph (100 km/h), about 60 miles (95 km) west of Puerto Escondido or about 150 mi (245 km) east-southeast of Acapulco.[12] The storm rapidly deteriorated to a remnant low, which persisted until dissipating on June 29.[12]
Carlos dropped heavy rainfall to portions of southern Mexico, peaking at 337 mm (13.3 in) in two locations in Guerrero.[13] In northwestern Oaxaca, seven people were killed when the heavy rainfall triggered a mudslide. Mudslides were reported elsewhere in the state, and about 30,000 homes were damaged.[14] Throughout its path, the storm affected about 148,000 people. Monetary damage totaled 86.7 million pesos (2003 MXN, $8 million 2003 USD).[15] At least nine people were killed throughout the country and there was also a report of two missing fishermen.[16][14]
Tropical Storm Dolores
| Tropical storm (SSHWS) | |
  | |
| Duration | July 6 – July 8 |
|---|---|
| Peak intensity | 40 mph (65 km/h) (1-min) 1005 mbar (hPa) |
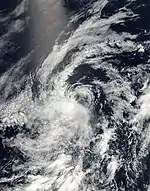
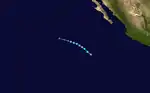
A tropical wave had entered the eastern north Pacific Ocean from Central America on June 30, and four days later, became classifiable by the Dvorak technique while the wave was centered 1,160 km (720 mi) south of Manzanillo. Convection developed within an area of low pressure embedded in a tropical wave as it moved west. The disturbance organized into Tropical Depression Four-E on July 6 1,205 km (750 mi) to the south-southwest of the tip of the Baja California Peninsula. It soon strengthened further into Tropical Storm Dolores as it moved to the northwest and reached its peak as a minimal tropical storm with winds of 40 mph (65 km/h). However, east-northeasterly shear had an adverse effect on Dolores, with the low-level center becoming exposed on satellite imagery and it weakened back into a depression 12 hours after becoming a tropical storm. The northwest motion caused by a mid-level ridge north and northeast of the cyclone brought it over colder water and it degenerated into a post-tropical remnant low on July 8, with full dissipation occurring on July 9.[17]
Tropical Storm Enrique
| Tropical storm (SSHWS) | |
.jpg.webp) 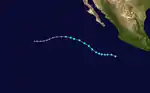 | |
| Duration | July 10 – July 13 |
|---|---|
| Peak intensity | 65 mph (100 km/h) (1-min) 993 mbar (hPa) |
On July 6, a tropical wave entered the northeastern Pacific Ocean from the coast of South America. A low pressure system then developed and began to show sins of organization on July 9. The depression was designated Tropical Depression Five-E midday on July 10 while located 650 mi (1,045 km). The storm became more organized and was named Tropical Storm Enrique the next day as it tracked west-northwest.[18] The storm continued to strengthen and at one point was forecast to briefly become a hurricane.[19] This did not occur as the storm reached its peak strength with 65 mph (100 km/h) winds, an intensity it maintained for 24 hours. The storm's relative high latitude of formation for that time of year and northwestward track resulted in limited time for Enrique to strengthen before encountering significantly cooler water associated with the California Current late on July 12. Due to the cold water temperatures Enrique rapidly weakened, despite low wind shear. The storm degenerated into a remnant low late on July 13 and continued to move west before dissipating after a further three days. Enrique had no effects on land, but there were two ship reports of tropical storm force winds, although these measurements did not pass quality control.[18]
Tropical Storm Felicia
| Tropical storm (SSHWS) | |
  | |
| Duration | July 17 – July 23 |
|---|---|
| Peak intensity | 50 mph (85 km/h) (1-min) 1000 mbar (hPa) |
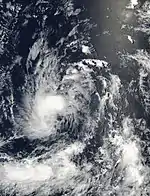
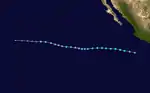
A tropical wave passed over Central America on July 12 and started to become more organized two days later, which prompted Dvorak satellite estimates. Following a further increased in organization, the NHC designated the system a tropical depression on July 17 as it continued to move to the west.[18] Tracking south of a subtropical ridge, the depression became Tropical Storm Felicia the next day and as there was initially low shear over the system, the NHC predicted that it would become a minimal hurricane.[20] However, the storm remained disorganized and peaked with 50 mph (85 km/h) winds late on July 18. The storm gradually weakened under increasing shear as it headed west, weakening back to a tropical depression on July 20. After a west-northwestward turn, The remnant low entered the central Pacific before dissipating on July 24 well to the east of Hawaii. Felicia had no effect on land.[21]
Tropical Storm Guillermo
| Tropical storm (SSHWS) | |
  | |
| Duration | August 7 – August 12 |
|---|---|
| Peak intensity | 60 mph (95 km/h) (1-min) 997 mbar (hPa) |
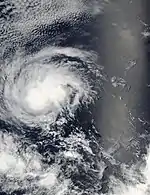
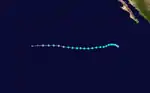
A tropical wave entered the eastern north Pacific Ocean on August 1 and began to show signs of organization three days later. A weak surface low developed within the tropical wave on August 6 and the convection associated with it became more concentrated. The circulation of the system became better defined and a Tropical Depression, Seven-E, formed early the next day. Although the depression was initially forecast to dissipate quickly,[22] it became more organized as it moved to the west. On August 8, the depression was upgraded Tropical Storm Guillermo. Later that day, Guillermo reached its peak strength with 60 mph (95 km/h) winds that day. It maintained this strength for a full day, until outflow from the developing Tropical Storm Hilda 690 mi (1,110 km) to its east disrupted its convection. Continuing westward, Guillermo weakened into a tropical depression on August 11. After the wind shear direction shifted westerly, all the deep convection collapsed on August 12. The remnant low entered the central Pacific shortly before dissipating on August 13.[23]
Tropical Storm Hilda
| Tropical storm (SSHWS) | |
  | |
| Duration | August 9 – August 13 |
|---|---|
| Peak intensity | 40 mph (65 km/h) (1-min) 1004 mbar (hPa) |
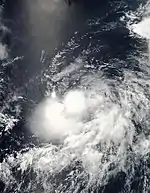
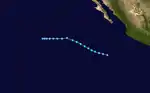
A tropical wave developed persistent thunderstorm activity on August 5, which soon became more organized, forming into Tropical Depression Eight-E to the south of Cabo San Lucas. An impressive outflow pattern caused the NHC to predict an intensification to hurricane strength,[24] but strong easterly shear affected the system. The depression became Tropical Storm Hilda on August 10 but did not get any stronger than a minimal tropical storm with winds of 40 mph (65 km/h). Hilda moved west-northwest before it moved over colder waters, which caused it to weaken. Low-level flow forced the weakening cyclone westwards and it dissipated on August 13, having never approached land.[25]
Tropical Depression One-C
| Tropical depression (SSHWS) | |
  | |
| Duration | August 15 – August 17 |
|---|---|
| Peak intensity | 35 mph (55 km/h) (1-min) 1009 mbar (hPa) |
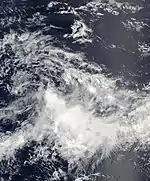
The only tropical cyclone to form in the central Pacific proper in 2003 developed on August 15, and resulted from an interaction between remnants of Tropical Storm Guillermo and a non-tropical low. Unfavorable wind shear prevented the development of the depression and weakened as it drifted to the west. It weakened to a post-tropical remnant low on August 17 and never regained depression strength. The remnant passed just south of Johnston Atoll before it crossed the International Date Line on August 20. The storm had a minimal effect on the weather of the Hawaiian Islands.[6]
Hurricane Ignacio
| Category 2 hurricane (SSHWS) | |
.jpg.webp) 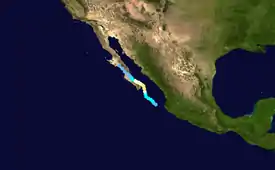 | |
| Duration | August 22 – August 27 |
|---|---|
| Peak intensity | 105 mph (165 km/h) (1-min) 970 mbar (hPa) |
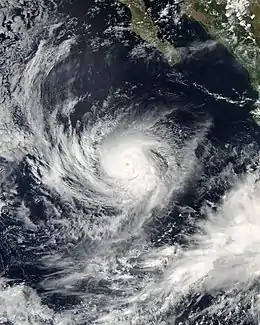
A tropical wave organized into a distinct area of disturbed weather just south of the Mexican port of Manzanillo, on August 22 and gradually moved to the northwest. It became Tropical Depression Nine-E off Cabo Corrientes two days later while it was located about 115 mi (185 km) west of the Mexico mainland or about 220 mi (345 km) southeast of the southern tip of the Baja California Peninsula. Under the influence of favorable atmospheric conditions steadily strengthened and obtained tropical storm status on August 25. Early on August 24, Ignacio attained hurricane status,[26] marking the latest formation of the first hurricane of a season recorded in the East Pacific since reliable satellite observation began in 1966.[27] Ignacio reached its peak intensity on August 26 as a Category 2 hurricane on the Saffir-Simpson scale, with winds of 105 mph (165 km/h). Ignacio tracked northwest across the southern Gulf of California and began to weaken due to land interaction before it made landfall at an intensity of 80 mph (130 km/h) just to the east of La Paz. Ignacio weakened overland and dissipated early on August 28 over central Baja California.[26]
The slow motion of Ignacio produced heavy rainfall across the southern portion of the Baja California Peninsula, including a peak 24‑hour total of 7.25 in (184 mm) in Ciudad Constitución,[28] which resulted in severe flooding and drought relief.[26][29] The passage of the hurricane left citizens in Todos Santos without power for around 24 hours.[30] The closed roads and the airport in La Paz.[29] Overall, Ignacio was responsible for approximately US$21 million of damage.[31] Two rescue workers drowned in the flood waters brought by the storm and some 10,000 people were evacuated to shelters.[32] Six municipalities in Baja California Sur were declared disaster areas,[33] The remnants of Ignacio produced thunderstorm activity in high terrain areas of central interior California, resulting in 3,500 customers losing power, 14 forest fires, and over 300 lightning strikes.[34]
Hurricane Jimena
| Category 2 hurricane (SSHWS) | |
  | |
| Duration | August 28 – September 5 |
|---|---|
| Peak intensity | 105 mph (165 km/h) (1-min) 970 mbar (hPa) |
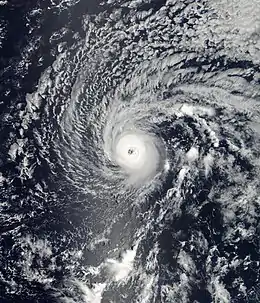
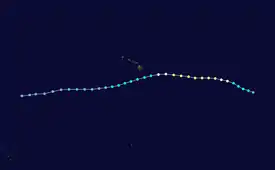
On August 28, an area of disturbed weather within the Intertropical Convergence Zone developed into Tropical Depression Ten-E, some 1725 miles (2775 km) east of the Hawaiian Islands following the development of a closed low-level circulation. The storm began to steadily intensify as it tracked over warm ocean waters, attaining tropical storm status at noon. Shortly after developing an eye, Jimena was upgraded into a hurricane on August 29. The storm moved to the west, entering the central Pacific as it continued to strengthen. After reaching its peak strength with 105 mph (169 km/h) winds 800 mi (1300 km) to the east of Hawaii it began to weaken as a result of increased shear. The storm passed about 120 mi (195 km) to the south of the southern tip of Big Island on September 1, just after losing hurricane strength. The storm then moved west, south of the archipelago while continuing to weaken due to a combination of shear and a more stable air mass, with Jimena weakening inyto a tropical depression on September 3. The weakening Jimena crossed the International Date Line before dissipating on September 5.[35]
Forecasters at the Central Pacific Hurricane Center issued a hurricane watch for the Big Island on August 31 at 00:00 UTC.[36] The storm brought 6 to 10 in (150 to 250 mm) of rain and 11 ft (3.3 m) surf to the island of Hawaii,[37] resulting in minor flooding on the eastern side of the Big Island.[38] There were also tropical storm force winds recorded on several of the Hawaiian Islands,[37] which knocked down trees and damaged power lines, resulting in 1,300 residents without electricity.[39]
Tropical Storm Kevin
| Tropical storm (SSHWS) | |
  | |
| Duration | September 3 – September 6 |
|---|---|
| Peak intensity | 40 mph (65 km/h) (1-min) 1000 mbar (hPa) |
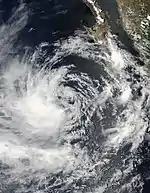
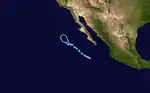
A tropical wave entered the northeastern Pacific Ocean on August 21 but remained devoid of any convective activity until August 28. A road surface low developed on August 29, but convective activity remained poorly organized. Tracking west-northwest around the western periphery of a ridge over Mexico, surface pressure of the system gradually fell, and by September 3, the disturbance was organized enough to be classified by the Dvorak technique. At noon, an increase in Dvorak estimates prompted the designation of Tropical Depression Eleven-E on September 3 roughly 345 mi (555 km) south-southwest of the tip of Baja California. The broad wind field prevented significant intensification and the system developed at an unusually high latitude, which placed the cyclone closer to cooler waters. The depression reached tropical storm strength on September 4. Although wind shear was light, Kevin weakened into a depression after just six hours, as it moved over colder waters as Kevin became less organized. On September 6 the system degenerated to a non-convective low-pressure area, which managed to survive for four days before finally dissipating. Tropical Storm Kevin had no effects on land.[40]
Hurricane Linda
| Category 1 hurricane (SSHWS) | |
  | |
| Duration | September 13 – September 17 |
|---|---|
| Peak intensity | 75 mph (120 km/h) (1-min) 987 mbar (hPa) |
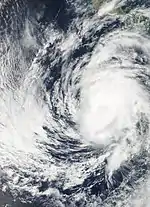
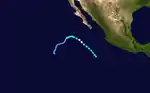
A tropical wave crossed Central America and entered the northeastern Pacific Ocean on September 6. Convection began to increase in a tropical wave on September 9 and three days later a broad surface low developed. Midday on September 13, the disturbance organized into Tropical Depression Twelve-E about 390 mi (630 km) to the southwest of the Mexican port of Manzanillo. The cyclone moved to the northwest and was classified as a tropical storm on September 14.[41] Linda steadily intensified as rainbands increased and upper-level outflow expanded.[42] On September 15, Linda was upgraded into a hurricane while also reaching its peak strength of 75 mph (120 km/h).[41] The NHC predicted further slight traditional strengthening,[43] but this did not occur and Linda weakened back to a tropical storm after just 12 hours as a hurricane. As the storm continued to weaken it turned to the west and then to the southwest, becoming a tropical depression on September 17. The remnant drifted to the southwest and finally dissipated on September 23. There were no reports of any effects from this storm.[41]
Hurricane Marty
| Category 2 hurricane (SSHWS) | |
  | |
| Duration | September 18 – September 24 |
|---|---|
| Peak intensity | 100 mph (155 km/h) (1-min) 970 mbar (hPa) |
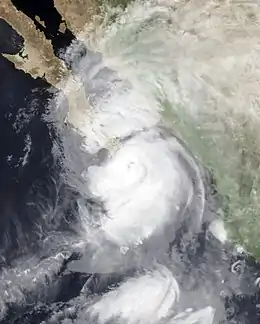
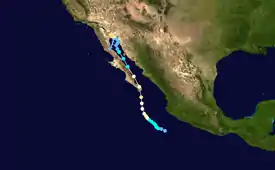
A tropical wave moved into the northeastern Pacific Ocean on September 10 and the convection associated with it gradually increased. By September 19, while the system was south-southeast of Cabo San Lucas, it organized into Tropical Depression Thirteen-E. The depression strengthened as it headed towards the Baja California Peninsula, becoming a tropical storm on September 19 and a hurricane two days later. Marty began moving north-northwestward in response to a high pressure ridge to the west, and continued to strengthen, reaching a peak intensity of 100 mph (155 km/h) early on September 22. Marty then moved northward at an increased speed before making landfall 10 mi (15 km) northeast of Cabo San Lucas. After moving over the southern tip of the peninsula, Marty moved up the western coast of the Gulf of California, gradually weakening as it did so. The storm weakened to a tropical storm on September 23 and a tropical depression later that day. After making a second landfall near Puerto Peñasco as a tropical depression, Marty dissipated two days later after meandering over the northern Gulf of California.[44]
Hurricane Marty was the deadliest storm of the 2003 Pacific hurricane season and was responsible for 12 deaths and either damaged or destroyed over 4,000 homes;[44] two of the deaths occurred when a tree fell on a car in Sinaloa.[45] A 5-foot (1.5 m) storm surge flooded parts of La Paz, and sank 35 yachts moored in various ports.[46] Five people drowned after their cars were swept away by floodwaters while trying to cross a flooded stream. The floods also damaged 4,000–6,000 homes and buildings and significantly disrupted water and communications for an extended period of time.[47] Overall, 6,000 people were affected and total damage from the storm was estimated at US$100 million,[48] making Marty the costliest east Pacific storm of the year.[31] The outer bands of Marty brought dropped locally heavy rains to extreme southwestern Arizona, but there were no reports of flooding.[44]
Hurricane Nora
| Category 2 hurricane (SSHWS) | |
  | |
| Duration | October 1 – October 9 |
|---|---|
| Peak intensity | 105 mph (165 km/h) (1-min) 969 mbar (hPa) |
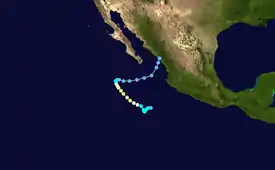
A tropical wave moved over Central America on September 25 and moved parallel to the south Mexican coast. It became more organized on October 1 and developed into Tropical Depression Fourteen-E to the south of the Baja California Peninsula. It continued to strengthen as it moved northwest in favorable conditions, becoming a tropical storm the next day. On October 4, it became a hurricane and reached its peak that day as a mid-level Category 2 hurricane with 105 mph (165 km/h) winds. Nora made a sharp turn to the east and began to weaken, as the result of the influence of a mid-level trough and the outflow from Hurricane Olaf to the southeast. The cyclone rapidly weakened before it made landfall just north of Mazatlán, on October 9. Nora dissipated over land soon after landfall.[49] Nora dropped locally heavy rainfall near landfall, peaking at 3.75 in (95.3 mm) in Mazatlán.[50] Moisture from the remnants of Nora and Olaf interacted with an upper-level low to produce heavy rainfall across Texas, producing flooding near Waco that forced a family to evacuate.[51]
Hurricane Olaf
| Category 1 hurricane (SSHWS) | |
.jpg.webp) 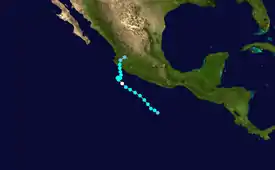 | |
| Duration | October 3 – October 8 |
|---|---|
| Peak intensity | 75 mph (120 km/h) (1-min) 987 mbar (hPa) |
A tropical wave located to the south-southeast of Acapulco spawned a low-level circulation on October 2 and developed into Tropical Depression Fifteen-E the next day. The depression strengthened into Tropical Storm Olaf six hours after forming as it moved to the northwest in a low shear environment. Olaf reached its peak strength as a minimal hurricane with 75 mph (120 km/h) winds on October 5 and developed a partial eyewall. The storm soon became disorganized and was only a hurricane for six hours as increased wind shear took toll on the storm. Olaf before turning towards the Mexican coast and re-intensified slightly before making landfall near Manzanillo on October 7, with winds of 60 mph (95 km/h). The next day, Olaf dissipated overland.[52]
Olaf dropped more significant rainfall to Mexico than Hurricane Nora,[53] resulting in severe flooding in the states of Jalisco and Guanajuato which damaged crops, roads and over 12,000 houses. However, there were no deaths as a result of Hurricane Olaf.[52]
Hurricane Patricia
| Category 1 hurricane (SSHWS) | |
  | |
| Duration | October 20 – October 26 |
|---|---|
| Peak intensity | 80 mph (130 km/h) (1-min) 984 mbar (hPa) |
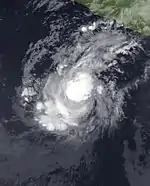
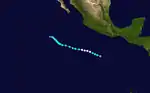
A tropical wave crossed Central America on October 17. Over the next few days, deep convection slowly become more concentrated and became classifiable via the Dvorak technique at 23:45 UTC on October 19. On October 20, the system was designated a tropical depression while located to the south of Acapulco. Following an increase in banding features in all quadrants, the depression was upgraded into Tropical Storm Patricia at 18:00 UTC that day. After an eye became apparent on satellite imagery, Patricia was classified as a hurricane at noon on October 21, as it moved further west-northwest, steered by east-southeasterlies caused by the presence of a deep layered ridge to the north of the cyclone. Twelve hours later, its winds were increased to its peak intensity of 80 mph (130 km/h), though this estimate was slightly below than Dvorak-derived satellite intensity estimates.[54] Although the NHC forecast further strengthening,[55] with the Geophysical Fluid Dynamics Laboratory model forecasting Patricia to turn towards Mexico as a major hurricane, this did not occur. An upper-level trough over the Baja California Peninsula resulted in westerly shear over Patricia, which caused the low-level center to become displaced to the west of the deepest convection. This structure prompted weakening, and on October 22, Patricia was downgraded to below hurricane strength. Patricia continued to weaken until around noon on October 24, when the shear relaxed slightly, resulting in shower activity increasing over the center again. Consequently, Patrica briefly restrengthened slightly. Later on October 24 , the system turned toward the northwest in response to a weakness in the ridge caused by the trough near the Baja California Peninsula. The storm weakened further to a depression on October 25 as it lost all its deep convection, and it dissipated the next day around 600 mi (965 km) south-southwest of Cabo San Lucas, ending the season. Hurricane Patricia had no effects on land.[54]
Storm names
The following list of names was used to name storms that formed in the northeast Pacific in 2003. Names that were not assigned are marked in gray. No names were retired by the World Meteorological Organization, therefore this list was used again in the 2009 season.[56] This is the same list which was used for the 1997 season except for Patricia, which replaced Pauline.[57]
|
|
For storms that form in the Central Pacific Hurricane Center's area of responsibility, encompassing the area between 140 degrees west and the International Date Line, all names are used in a series of four rotating lists.[58]
Season effects
This is a table of all the storms that have formed in the 2003 Pacific hurricane season. It includes their duration, names, landfall(s), denoted in parentheses, damages, and death totals. Deaths in parentheses are additional and indirect (an example of an indirect death would be a traffic accident), but were still related to that storm. Damage and deaths include totals while the storm was extratropical, a wave, or a low, and all the damage figures are in 2003 USD.
| Saffir–Simpson scale | ||||||
| TD | TS | C1 | C2 | C3 | C4 | C5 |
| Storm name |
Dates active | Storm category
at peak intensity |
Max 1-min wind mph (km/h) |
Min. press. (mbar) |
Areas affected | Damage (USD) |
Deaths | Ref(s) | ||
|---|---|---|---|---|---|---|---|---|---|---|
| Andres | May 19 – 25 | Tropical storm | 60 (95) | 997 | None | None | None | [10] | ||
| Blanca | June 17 – 22 | Tropical storm | 60 (95) | 997 | None | None | None | [11] | ||
| Carlos | June 26 – 27 | Tropical storm | 65 (100) | 996 | Southwestern Mexico | $8 million | 9 | [12][14][15][16] | ||
| Dolores | July 6 – 8 | Tropical storm | 40 (65) | 1005 | None | None | None | [17] | ||
| Enrique | July 10 – 13 | Tropical storm | 65 (100) | 993 | None | None | None | [18] | ||
| Felicia | July 17 – 23 | Tropical storm | 50 (85) | 1000 | None | None | None | [21] | ||
| Guillermo | August 7 – 12 | Tropical storm | 60 (95) | 997 | None | None | None | [23] | ||
| Hilda | August 9 – 13 | Tropical storm | 40 (65) | 1004 | None | None | None | [25] | ||
| One-C | August 15 – 17 | Tropical depression | 35 (55) | 1009 | None | None | None | [6] | ||
| Ignacio | August 22 – 27 | Category 2 hurricane | 105 (165) | 970 | Baja California Peninsula, Sonora, California | $21 million | 2 | [31][32] | ||
| Jimena | August 28 – September 5 | Category 2 hurricane | 105 (165) | 970 | Hawaii | Minimal | None | [37] | ||
| Kevin | September 3 – 6 | Tropical storm | 40 (65) | 1000 | None | None | None | [40] | ||
| Linda | September 13 – 17 | Category 1 hurricane | 75 (120) | 987 | None | None | None | [41] | ||
| Marty | September 18 – 24 | Category 2 hurricane | 100 (155) | 970 | Baja California Peninsula, Sonora, Sinaloa, Arizona | $100 million | 12 | [44][48] | ||
| Nora | October 1 – 9 | Category 2 hurricane | 105 (165) | 969 | Mexico, Texas | Minimal | None | [49] | ||
| Olaf | October 3 – 8 | Category 1 hurricane | 75 (120) | 987 | Mexico, Texas | Minimal | None | [52] | ||
| Patricia | October 20 – 26 | Category 1 hurricane | 80 (130) | 984 | None | None | None | [54] | ||
| Season aggregates | ||||||||||
| 17 systems | May 19 – October 26 | 105 (165) | 969 | $129 million | 23 | |||||
See also
- Tropical cyclones in 2003
- List of Pacific hurricanes
- Pacific hurricane season
- 2003 Atlantic hurricane season
- 2003 Pacific typhoon season
- 2003 North Indian Ocean cyclone season
- South-West Indian Ocean cyclone seasons: 2002–03, 2003–04
- Australian region cyclone seasons: 2002–03, 2003–04
- South Pacific cyclone seasons: 2002–03, 2003–04
References
- Neal Dorst (June 2, 2016). "TCFAQ G1) When is hurricane season?". Atlantic Oceanographic and Meteorological Laboratory. Archived from the original on May 16, 2009. Retrieved July 24, 2018.
- "Background Information: East Pacific Hurricane Season". National Oceanic and Atmospheric Administration. Climate Prediction Center. May 22, 2014. Archived from the original on September 2, 2012. Retrieved May 29, 2014.
- NOAA (June 12, 2003). "NOAA issues first experimental Eastern Pacific Hurricane Outlook". National Oceanic and Atmospheric Administration. Archived from the original on August 12, 2014. Retrieved August 10, 2006.
- Beven, John L.; Avila, Lixion A.; Franklin, James L.; Lawrence, Miles B.; Pasch, Richard J.; Stewart, Stacy R. (May 2005). "Eastern North Pacific Hurricane Season of 2003". Monthly Weather Review. 133 (5): 1403–1414. Bibcode:2005MWRv..133.1403B. doi:10.1175/MWR2917.1.
- "NOAA expects near Average Central Pacific Hurricane Season". National Oceanic and Atmospheric Administration. May 19, 2003. Archived from the original on October 6, 2013. Retrieved August 10, 2006.
- Central Pacific Hurricane Center (2004). "2003 Central North Pacific Tropical Cyclones". National Oceanic and Atmospheric Administration. Archived from the original on August 25, 2006. Retrieved August 10, 2006.
- RA IV Hurricane Committee (2004). "Final Report of the Twenty-Sixth Session" (PDF). World Meteorological Organization. pp. 33, 77. Archived from the original (PDF) on September 21, 2006. Retrieved August 10, 2006.
- "Northeast Pacific Ocean Historical Tropical Cyclone Statistics". Colorado State University. Archived from the original on February 1, 2020. Retrieved July 28, 2020.
- IFRC (October 23, 2003). "Mexico: Post-hurricane flooding Appeal No. 22/03". Archived from the original on September 27, 2007. Retrieved August 10, 2006.
- National Hurricane Center (2003). "Tropical Cyclone Report: Tropical Storm Andres" (PDF). National Oceanic and Atmospheric Administration. Retrieved May 22, 2015.
- National Hurricane Center (2003). "Tropical Cyclone Report: Tropical Storm Blanca" (PDF). National Oceanic and Atmospheric Administration. Retrieved May 22, 2015.
- Miles B. Lawrence (August 4, 2003). "Tropical Storm Carlos Tropical Cyclone Report" (PDF). National Hurricane Center. Archived from the original on May 10, 2009. Retrieved May 22, 2015.
- David M. Roth. "Tropical Storm Carlos Rainfall Summary". Hydrometeorological Prediction Center. Archived from the original on December 19, 2014. Retrieved May 26, 2009.
- "Tropical Storm Carlos kills seven in Mexico". Deutsche Presse-Agentur. June 30, 2003.
- Sistema Nacional de Protección Civil: Centro Nacional de Prevención de Desastres (March 2004). Informe de la Temporada de Ciclones Tropicales del 2003 (PDF) (Report) (in Spanish). El Secretario de Gobernación de Mexico. Retrieved May 30, 2009.
- "Tropical Storm Carlos dissipates after causing minor damage along Mexico's southern Pacific coast". Associated Press. June 23, 2003.
- National Hurricane Center (2003). "Tropical Cyclone Report: Tropical Storm Dolores" (PDF). National Oceanic and Atmospheric Administration. Retrieved May 22, 2015.
- National Hurricane Center (2003). "Tropical Cyclone Report: Tropical Storm Enrique" (PDF). National Oceanic and Atmospheric Administration. Retrieved May 22, 2015.
- National Hurricane Center (2003). "Tropical Storm Enrique Discussion No. 7". National Oceanic and Atmospheric Administration. Archived from the original on October 12, 2012. Retrieved August 9, 2006.
- National Hurricane Center (2003). "Tropical Storm Felicia Discussion No. 3". National Oceanic and Atmospheric Administration. Archived from the original on October 12, 2012. Retrieved August 9, 2006.
- National Hurricane Center (2003). "Tropical Cyclone Report: Tropical Storm Felicia" (PDF). National Oceanic and Atmospheric Administration. Retrieved May 22, 2015.
- National Hurricane Center (2003). "Tropical Depression Seven-E Discussion No. 1". National Oceanic and Atmospheric Administration. Archived from the original on October 12, 2012. Retrieved August 9, 2006.
- National Hurricane Center (2003). "Tropical Cyclone Report: Tropical Storm Guillermo" (PDF). National Oceanic and Atmospheric Administration. Retrieved May 22, 2015.
- National Hurricane Center (2003). "Tropical Depression Eight-E Discussion No. 2". National Oceanic and Atmospheric Administration. Archived from the original on October 12, 2012. Retrieved August 9, 2006.
- National Hurricane Center (2003). "Tropical Cyclone Report: Tropical Storm Hilda" (PDF). National Oceanic and Atmospheric Administration. Retrieved May 22, 2015.
- National Hurricane Center (2003). "Tropical Cyclone Report: Hurricane Ignacio" (PDF). National Oceanic and Atmospheric Administration. Retrieved May 22, 2015.
- Stacy Stewart (2003). "Hurricane Ignacio Discussion Ten". National Hurricane Center. Retrieved January 17, 2007.
- Servicio Meteorologico Nacional (2003). "Huracán "Ignacio" del Océano Pacífico" (in Spanish). Archived from the original on October 4, 2006. Retrieved January 17, 2007.
- Mark Stevenson (2003). "Ignacio fills reservoirs while tourists whine about delays". Sun-Sentinel. Archived from the original on December 21, 2006. Retrieved January 18, 2007.
- "Todos Santos Hurricanes". 2003. Archived from the original on May 17, 2006. Retrieved January 17, 2007.
- Foro Consultivo Cientifico y Technológio (2005). "Desastres mayores registrados en México de 1980 a 2003" (PDF) (in Spanish). p. 20. Archived (PDF) from the original on September 1, 2006. Retrieved August 10, 2006.
- "Hurricane Ignacio forces 10,000 to take shelter". Agence France-Presse. August 25, 2003. Archived from the original on September 27, 2007. Retrieved August 9, 2006.
- Government of Mexico (2003). "Emite Segob Declaratoria de Emergencia para dos municipios más de Baja California Sur" (in Spanish). Retrieved January 18, 2007.
- National Climatic Data Center (2003). Event Report for California (Report). Archived from the original on May 19, 2011. Retrieved January 18, 2007.
- National Hurricane Center (2003). "Tropical Cyclone Report: Hurricane Jimena" (PDF). National Oceanic and Atmospheric Administration. Retrieved May 22, 2015.
- "Hurricane Jimena, packing 100 mph winds, heads for Hawaii". The Columbian. Associated Press. 2003. Archived from the original on October 20, 2012. Retrieved May 30, 2008.
- Central Pacific Hurricane Center (2004). "Overview of Hurricane Jimena". National Oceanic and Atmospheric Administration. Archived from the original on August 20, 2006. Retrieved August 9, 2006.
- National Data Climatic Center (2003). "Event Report for Hawaii". National Data Climatic Center. Archived from the original on May 20, 2011. Retrieved June 4, 2008.
- Rod Thompson (September 2, 2003). "Storm rain brings relief to parched Big Island". Honolulu Star-Bulletin. Retrieved June 30, 2008.
- National Hurricane Center (2003). "Tropical Cyclone Report: Tropical Storm Kevin" (PDF). National Oceanic and Atmospheric Administration. Retrieved May 22, 2015.
- National Hurricane Center (2003). "Tropical Cyclone Report: Hurricane Linda" (PDF). National Oceanic and Atmospheric Administration. Retrieved May 22, 2015.
- National Hurricane Center (2003). "Tropical Storm Linda Discussion No. 4". National Oceanic and Atmospheric Administration. Archived from the original on October 12, 2012. Retrieved August 9, 2006.
- National Hurricane Center (2003). "Hurricane Linda Discussion No. 7". National Oceanic and Atmospheric Administration. Archived from the original on October 12, 2012. Retrieved August 9, 2006.
- National Hurricane Center (2004). "Tropical Cyclone Report: Hurricane Marty" (PDF). National Oceanic and Atmospheric Administration. Retrieved May 22, 2015.
- "Six dead, several missing in Mexico". Agence France-Presse. September 23, 2003. Retrieved July 4, 2006.
- "Hurricane-turned-depression Marty kills six in Mexico". Agence France-Presse. September 23, 2003. Archived from the original on September 27, 2007. Retrieved August 9, 2006.
- "Hurricane Marty kills five in Mexico, Baja California". Agence France-Presse. September 23, 2003. Retrieved September 4, 2006.
- Centre for Research on the Epidemiology of Disasters. "EM-DAT: The Emergency Events Database". Université catholique de Louvain.
- National Hurricane Center (2003). "Tropical Cyclone Report: Hurricane Nora" (PDF). National Oceanic and Atmospheric Administration. Retrieved May 22, 2015.
- Huracán "Nora" del Océano Pacífico (Report) (in Spanish). Servicio Meteorológico Nacional (Mexico). November 26, 2011. Archived from the original on December 27, 2012. Retrieved June 26, 2011.
- "Possible tornado hits Houston suburb; floods hit Waco area". Beaumont Enterprise. Associated Press. October 9, 2003. Retrieved June 26, 2011.
- National Hurricane Center (2003). "Tropical Cyclone Report: Hurricane Olaf" (PDF). National Oceanic and Atmospheric Administration. Retrieved May 22, 2015.
- David M. Roth. "Hurricanes Nora/Olaf – October 3–8, 2003". Hydrometeorological Prediction Center. Retrieved October 31, 2008.
- National Hurricane Center (2003). "Tropical Cyclone Report: Hurricane Patricia" (PDF). National Oceanic and Atmospheric Administration. Retrieved May 22, 2015.
 This article incorporates text from this source, which is in the public domain.
 - National Hurricane Center (2003). "Hurricane Patricia Discussion No. 7". National Oceanic and Atmospheric Administration. Archived from the original on October 12, 2012. Retrieved August 9, 2006.
- "Tropical Cyclone Names". National Hurricane Center. National Oceanic and Atmospheric Administration. October 4, 2003. Archived from the original on October 4, 2003. Retrieved May 8, 2013.
- Interdepartmental Hurricane Conference (2007). "The Nation's Hurricane Program: An Interagency Success Story" (PDF). Archived from the original (PDF) on March 3, 2009. Retrieved December 29, 2007.
- "Pacific Tropical Cyclone Names" (PHP). Central Pacific Hurricane Center. National Oceanic and Atmospheric Administration. April 11, 2013. Archived from the original on May 15, 2013. Retrieved May 8, 2013.
External links
 |
Wikimedia Commons has media related to 2003 Pacific hurricane season. |
- National Hurricane Center Website
- National Hurricane Center's Eastern Pacific Tropical Weather Outlook
- Servicio Meteorológico Nacional Website (in Spanish)
- Joint Typhoon Warning Center Archived February 2, 2018, at the Wayback Machine
- NHC 2003 Pacific hurricane season archive
- HPC 2003 Tropical Cyclone Rainfall Pages
- Central Pacific Hurricane Center 2003 season summary
- Mariners Weather Log: Summary of the 2003 Pacific hurricane season

