Wisconsin's 4th congressional district
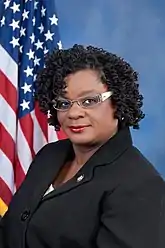
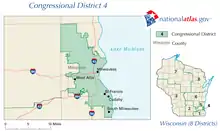
Wisconsin's 4th congressional district is a congressional district of the United States House of Representatives in Wisconsin, encompassing a part of Milwaukee County and including almost all of the city of Milwaukee (except the slivers of the city in Waukesha and Washington counties), as well as its working-class suburbs of Cudahy, St. Francis, South Milwaukee, and West Milwaukee. Recent redistricting has added the Milwaukee County North Shore communities of Glendale, Shorewood, Whitefish Bay, Fox Point, Bayside, and Brown Deer to the district. It is currently represented by Gwen Moore, a Democrat.
| Wisconsin's 4th congressional district | |||
|---|---|---|---|
.tif.png.webp) Wisconsin's 4th congressional district - since January 3, 2013. | |||
| Representative |
| ||
| Area | 111.90 sq mi (289.8 km2) | ||
| Distribution |
| ||
| Population (2019) | 704,146 | ||
| Median household income | $47,421[1] | ||
| Ethnicity | |||
| Cook PVI | D+25[3] | ||
In the 21st century, this has been the most Democratic congressional district in Wisconsin. John Kerry won 69% of the vote here in 2004. Barack Obama also swept the district in 2008, by a three-to-one margin over John McCain, with 75.39% of the vote to McCain's 23.61%.
Before the 2000 census, the 4th covered much of south Milwaukee, and extended into eastern Waukesha County. After Wisconsin lost a district in the 2000 census, the 4th was cut back to a Milwaukee County district.
Election results from presidential races
| Election results from presidential races | ||
|---|---|---|
| Year | Office | Results |
| 2000 | President | George W Bush 51% – Al Gore 45% |
| 2004 | President | John Kerry 70% – George W. Bush 30% |
| 2008 | President | Barack Obama 75% – John McCain 24% |
| 2012 | President | Barack Obama 75% – Mitt Romney 24% |
| 2016 | President | Hillary Clinton 73% – Donald Trump 22% |
| 2020 | President | Joe Biden 76% – Donald Trump 22% |
List of members representing the district
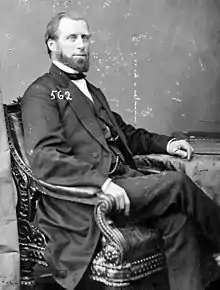
.jpg.webp)
.jpg.webp)
.jpg.webp)
.jpg.webp)
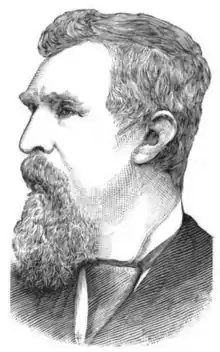
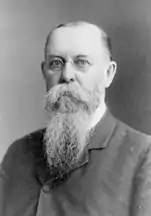
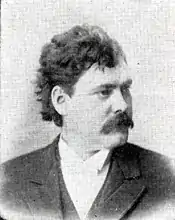
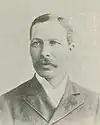
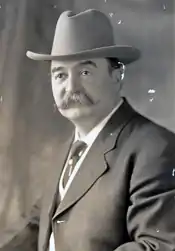

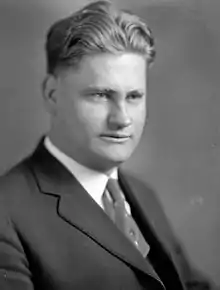
.jpg.webp)
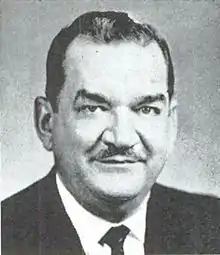

Recent election results
2012
| Party | Candidate | Votes | % | |
|---|---|---|---|---|
| Democratic | Gwen Moore (incumbent) | 235,257 | 72.21 | |
| Republican | Dan Sebring | 80,787 | 24.80 | |
| Independent | Robert R. Raymond | 9,277 | 2.85 | |
| none | Scattering | 467 | 0.14 | |
| Total votes | 325,788 | 100.0 | ||
2014
| Party | Candidate | Votes | % | |
|---|---|---|---|---|
| Democratic | Gwen Moore (incumbent) | 179,045 | 70.2 | |
| Republican | Dan Sebring | 68,490 | 26.9 | |
| Independent | Robert R. Raymond (write-in) | 7,002 | 2.8 | |
| N/A | Write-ins | 355 | 0.1 | |
| Total votes | 254,892 | 100.0 | ||
| Democratic hold | ||||
2016
| Party | Candidate | Votes | % | |
|---|---|---|---|---|
| Democratic | Gwen Moore (incumbent) | 220,181 | 76.7 | |
| Independent | Robert Raymond | 33,494 | 11.7 | |
| Libertarian | Andy Craig | 32,183 | 11.2 | |
| N/A | Write-ins | 1,051 | 0.4 | |
| Total votes | 286,909 | 100.0 | ||
| Democratic hold | ||||
2018
| Party | Candidate | Votes | % | |
|---|---|---|---|---|
| Democratic | Gwen Moore (incumbent) | 206,487 | 75.6 | |
| Republican | Tim Rogers | 59,091 | 21.7 | |
| Independent | Robert Raymond | 7,170 | 2.6 | |
| N/A | Write-ins | 339 | 0.1 | |
| Total votes | 273,087 | 100.0 | ||
| Democratic hold | ||||
2020
| Party | Candidate | Votes | % | |
|---|---|---|---|---|
| Democratic | Gwen Moore (incumbent) | 232,668 | 74.7 | |
| Republican | Tim Rogers | 70,769 | 22.7 | |
| Independent | Robert Raymond | 7,911 | 2.5 | |
| Write-in | 349 | 0.1 | ||
| Total votes | 311,697 | 100.0 | ||
| Democratic hold | ||||
Historical district boundaries
References
- Martis, Kenneth C. (1989). The Historical Atlas of Political Parties in the United States Congress. New York: Macmillan Publishing Company.
- Martis, Kenneth C. (1982). The Historical Atlas of United States Congressional Districts. New York: Macmillan Publishing Company.
- Congressional Biographical Directory of the United States 1774–present
- Specific
- "My Congressional District".
- "Census profile: Congressional District 4, WI".
- "Partisan Voting Index – Districts of the 115th Congress" (PDF). The Cook Political Report. April 7, 2017. Retrieved April 7, 2017.
- "Wisconsin Government Accountability Board County by County Congress Seats" (PDF). State of Wisconsin Government Accountability Board. November 21, 2012. Retrieved April 4, 2013.
- Scatterings votes are included as they were reported to the Clerk of the House of Representatives"Election Statistics US House of Representatives - 2012". Karen Haas, Clerk of the United States House of Representatives. February 28, 2013. Retrieved March 31, 2013.
- "Wisconsin Statewide Results General Election - November 4, 2014 Official Results". Wisconsin Secretary of State. November 4, 2014. Retrieved January 16, 2015.
- "Wisconsin Elections Commission". Wisconsin Elections Commission. November 8, 2016. Retrieved December 2, 2016.
- Johnson, Cheryl L. (February 28, 2019). "Statistics of the Congressional Election of November 6, 2018". Clerk of the U.S. House of Representatives. Retrieved April 27, 2019.
- "Canvass Results for 2020 General Election" (PDF). Wisconsin Elections Commission. Retrieved December 2, 2020.