Wisconsin's 7th congressional district
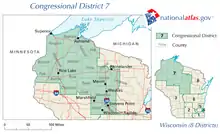
Wisconsin's 7th congressional district is a congressional district of the United States House of Representatives in northwestern and central Wisconsin; it is the largest congressional district in the state geographically, covering 20 counties (in whole or part), for a total of 18,787 sq mi. The district contains the following counties: Ashland, Barron, Bayfield, Burnett, St. Croix, Chippewa (partial), Clark, Douglas, Florence, Forest, Iron, Jackson (partial), Juneau (partial), Langlade, Lincoln, Marathon, Monroe (partial) Oneida, Polk, Price, Rusk, Sawyer, Taylor, Vilas, Washburn, and Wood (partial).
| Wisconsin's 7th congressional district | |||
|---|---|---|---|
.tif.png.webp) Wisconsin's 7th congressional district - since January 3, 2013. | |||
| Representative |
| ||
| Area | 18,786.53 sq mi (48,656.9 km2) | ||
| Distribution |
| ||
| Population (2019) | 714,544 | ||
| Median household income | $60,706[1] | ||
| Ethnicity | |||
| Cook PVI | R+12[3] | ||
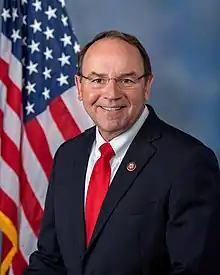
The district is currently represented by Republican Tom Tiffany.
While in 2008, the district gave 56% of the vote to Barack Obama, it has swung to the Republicans in recent presidential elections with Mitt Romney winning with 51% of the vote in 2012 and Donald Trump winning with 58% of the vote in 2016. As a result, the rural 7th has surpassed the suburban 5th as the most Republican district in Wisconsin.
Agriculture is a major industry and employer in the rural 7th district.[4] This district has been a major producer of milk from cows, grains, oilseeds, dry beans, and dry peas.[5] 60% of the farmland in this district is used for crop production, another major economic stimulant.
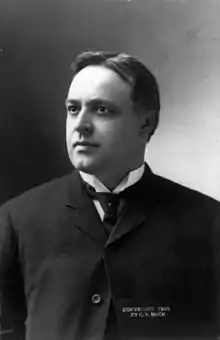
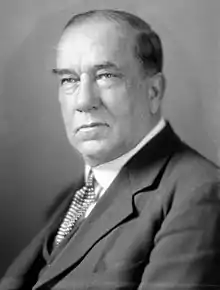
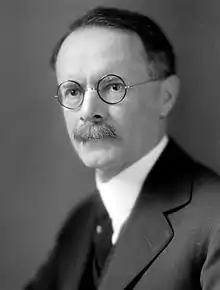
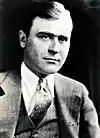
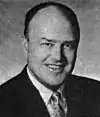
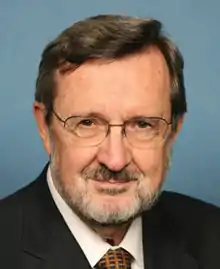
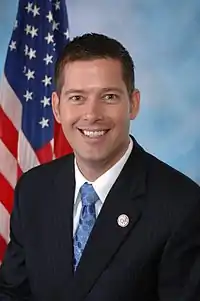
List of members representing the district
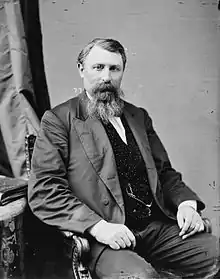
.jpg.webp)
.jpg.webp)
.jpg.webp)
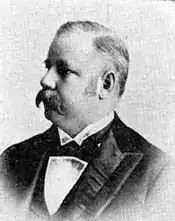
.jpg.webp)
Recent election results
2012
| Party | Candidate | Votes | % | |
|---|---|---|---|---|
| Republican | Sean Duffy (Incumbent) | 201,720 | 56.08 | |
| Democratic | Pat Kreitlow | 157,524 | 43.80 | |
| Write-In | Dale C. Hehner | 20 | 0.01 | |
| none | Scattering | 405 | 0.11 | |
| Total votes | 359,669 | 100.0 | ||
2014
| Party | Candidate | Votes | % | |
|---|---|---|---|---|
| Republican | Sean Duffy (incumbent) | 169,891 | 59.3 | |
| Democratic | Kelly Westlund | 112,949 | 39.4 | |
| Independent | Lawrence Dale | 3,686 | 1.3 | |
| N/A | Write-ins | 77 | 0.0 | |
| Total votes | 286,603 | 100.0 | ||
| Republican hold | ||||
2016
| Party | Candidate | Votes | % | |
|---|---|---|---|---|
| Republican | Sean Duffy (incumbent) | 223,418 | 61.6 | |
| Democratic | Mary Hoeft | 138,643 | 38.3 | |
| N/A | Write-ins | 210 | 0.1 | |
| Total votes | 362,271 | 100.0 | ||
| Republican hold | ||||
2018
| Party | Candidate | Votes | % | |
|---|---|---|---|---|
| Republican | Sean Duffy (incumbent) | 194,061 | 60.1 | |
| Democratic | Margaret Engebretson | 124,307 | 38.5 | |
| Independent | Ken Driessen | 4,416 | 1.4 | |
| Democratic | Bob Look (write-in) | 3 | 0.0 | |
| N/A | Write-ins | 53 | 0.0 | |
| Total votes | 322,840 | 100.0 | ||
| Republican hold | ||||
2020 special election
| Party | Candidate | Votes | % | ||
|---|---|---|---|---|---|
| Republican | Tom Tiffany | 109,594 | 57.2 | ||
| Democratic | Tricia Zunker | 81,955 | 42.8 | ||
| Total votes | 191,549 | 100.0 | |||
| Republican hold | |||||
2020
| Party | Candidate | Votes | % | |
|---|---|---|---|---|
| Republican | Tom Tiffany (incumbent) | 252,048 | 60.7 | |
| Democratic | Tricia Zunker | 162,741 | 39.2 | |
| Write-in | 218 | 0.1 | ||
| Total votes | 415,007 | 100.0 | ||
| Republican hold | ||||
Election results from recent presidential races
| Year | Results |
|---|---|
| 2000 | Gore 48 - 47% |
| 2004 | Kerry 50 - 49% |
| 2008 | Obama 56 - 43% |
| 2012 | Romney 51 - 48% |
| 2016 | Trump 58 - 37% |
| 2020 | Trump 59 - 39% |
Historical district boundaries
References
- General
- Martis, Kenneth C. (1989). The Historical Atlas of Political Parties in the United States Congress. New York: Macmillan Publishing Company.
- Martis, Kenneth C. (1982). The Historical Atlas of United States Congressional Districts. New York: Macmillan Publishing Company.
- Congressional Biographical Directory of the United States 1774–present
- Specific
- "My Congressional District".
- "Census profile: Congressional District 7, WI".
- "Introducing the 2021 Cook Political Report Partisan Voter Index". The Cook Political Report. April 15, 2021. Retrieved April 15, 2021.
- "The Future of Farming and Rural Life in Wisconsin: Findings, Recommendations, Steps to a Healthy Future" (PDF).
- "2012 Congressional District Profiles" (PDF). United States Department of Agriculture - National Agricultural Statistics Service.
- "Biographical Directory of the U.S. Congress - Retro Member details".
- "Wisconsin Government Accountability Board County by County Congress Seats" (PDF). State of Wisconsin Government Accountability Board. November 21, 2012. Retrieved April 4, 2013.
- Scatterings votes are included as they were reported to the Clerk of the House of Representatives"Election Statistics US House of Representatives - 2012". Karen Haas, Clerk of the United States House of Representatives. February 28, 2013. Retrieved March 31, 2013.
- "Wisconsin Statewide Results General Election - November 4, 2014 Official Results". Wisconsin Secretary of State. November 4, 2014. Retrieved January 16, 2015.
- "Wisconsin Elections Commission". Wisconsin Elections Commission. November 8, 2016. Retrieved December 2, 2016.
- Johnson, Cheryl L. (February 28, 2019). "Statistics of the Congressional Election of November 6, 2018". Clerk of the U.S. House of Representatives. Retrieved April 27, 2019.
- "Canvass Results for 2020 General Election" (PDF). Wisconsin Elections Commission. Retrieved December 2, 2020.