White demographic decline
White demographic decline, also known as White decline, is the persistent and pervasive fall of white people as a percentage of the total population in a given community, city, state, subregion, or nation. It is most demonstrable in the United States, where the total population was 89.5% white in 1950[1] and is projected to become 49.7% white by 2045.[2][3][4][5] Similar trends have been recorded in Canada, Oceania, and some European nations.[6][7] There is no evidence to suggest that these demographic trends will stop or slow down.
What makes white demographic decline distinct from demographic declines of other ethnicities is that there is no significant incline of white populations recorded in non-Western nations to respectively balance the significant decline of white populations throughout the Western world. White demographic decline has been recorded in most, if not all, Western nations, and has been recorded to varying degrees throughout smaller jurisdictions therein.
The cause of white demographic decline can be primarily attributed to two key factors: mass migration from non-white countries to white countries,[6] and birth rate differences between the different population groups.[8] White demographic decline has been observed in countries which explicitly record the number of resident white people at national censuses, such as the United States and United Kingdom; it has also been documented within jurisdictions where racial data is not explicitly collected by governments, including New Zealand, France, and South Africa.
The term "majority-minority" has been used to designate areas that were once majority-white and gradually shifted to become majority-nonwhite.[9] Perhaps the most significant example of this is in the US state of California, which was over 75% non-Hispanic white in 1970[10] and became 36.5% non-Hispanic white by 2019.[11] Two other prolific examples of this demographic shift can be seen in the US state of Texas and the country of Brazil.[12][13]
Scholars have attempted to address anticipated results of white demographic decline in relevant societies. Demographer Eric Kaufmann's theory of "Whiteshift" predicts transforming definitions and classifications of whiteness as mixed-race majorities emerge. Social psychologist Jennifer Richeson, who researches racial identity and interracial interactions, has outlined how a racial group's hostility towards other racial groups will increase in proportion to their awareness of a drop in their own percentage of the population.
Experts in extremism and terrorism have shown national ethnic demographic projections to be subject to exploitation by both radical and political right-wing groups, including adherence to conspiracy theories.[14][15] This has also manifested as anti-abortion[16][17] and anti-immigrant sentiment.[18]
Overview
Demography in national censuses
Various national demographic analyses of white populations have measured a demographic decline of white populations, as defined by their local nation-based censuses.[19] Research conducted at the University of Minnesota has observed the phenomenon of a decrease in white population share within jurisdictions in Europe, North America and Oceania:[20]
According to the most recent U.S. census, the non-Hispanic White population is shrinking (US Census Bureau, 2018). This trend has been observed in other White-majority countries including Canada (Statistics Canada, 2017), the UK (Coleman, 2016), and New Zealand (Stats New Zealand, 2004).
Regarding white populations internationally, and particularly in the Western world, demographer Eric Kaufmann has suggested that "In an era of unprecedented white demographic decline, it is absolutely vital for it to have a democratic outlet."[21][22] While sociologist Richard Alba believes this decline is exaggerated by the racial classification system used in the United States Census,[23] regarding the 2020 census, demographer William H. Frey has written:[24]
The Census Bureau was not projecting white population losses to occur until after 2024. This makes any national population growth even more reliant on other race and ethnic groups. The white demographic decline is largely attributable to its older age structure when compared to other race and ethnic groups. This leads to fewer births and more deaths relative to its population size.
Majority-minority predictions
Academics in demography have predicted that by the mid to late 21st century all nations which have embraced immigration (unanimously all from the Western world bar Russia) from the mid 20th century will have non-White or non-indigenous majority's in their nations. These vary from nation to nation; for example, in the United States, immigration rates have been significantly higher per proportion to the population of the country than in Europe and did not have a 100% white majority to begin with, compared to a place like the United Kingdom, for example, which will result in White Americans becoming a minority by 2045, sooner than most European nations.
Various predictions for when Western and Central Europe will be majority-minority have normally put the date at around the 2060s to the end of the century. A 2000 report by The Guardian entitled "The last days of a white world" initially put the prediction for a non-white Europe at around 2050, saying, "We are near a global watershed – a time when white people will not be in the majority in the developed world."[25] Demographer David Coleman has also conducted a study which suggests that by 2056 a number of European states, such as Austria, the Netherlands, Germany, the United Kingdom, Denmark, Norway and Sweden, will either have non-indigenous majorities or large ethnic minority populations.[26]
For North America, predictions around when a non-white majority will occur are sooner than in Europe. The time period is often predicted to be around the early-to mid-2040s when both Canada and the United States will be majority non-white. Initially, in 2009 the New York Times put the date at 2050[27] however this has been revised down in recent years to 2045.
There is no evidence that these present demographic trends will either slow down, be stopped or reversed.
Causes and factors
There are two main causes of White demographic decline: high immigration rates to majority-white regions from majority-nonwhite regions and a difference in the fertility rates between the waning white majority and the waxing non-white minority.
Some cite ageing as a cause for White demographic decline. However, the median age of an ethnic demographic can only grow older for two reasons: if the birth rates of that demographic are lower than they were previously, or if their life expectancy is growing longer. An increase in the median age of a demographic due to longer life expectancy does not cause that demographic to decline as a percentage of the total population; in fact, a longer life expectancy helps the given demographic to preserve itself against such a decline. The only way that the ageing of a demographic can be correlated to its decline as a percentage of the total population is if that demographic's birth rates are lower than they once were, thus shifting the median age upwards. When an ethnic demographic is ageing due to low birth rates, the ageing itself doesn't cause a decline in their percentage of the total population; the ageing is merely a symptom of the low birth rates of the younger generation(s).[28]
Ageing
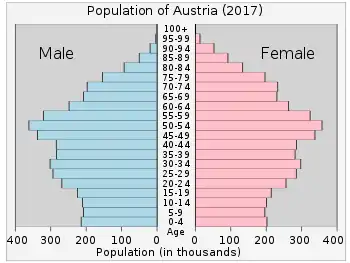
General population ageing, which is one of the main symptoms of White demographic decline, is a phenomenon which is most noticeably seen in Europe[29] and the United States.[30] It has been characterized by a long-term decline of European and North America's White populations and a "graying", in which the average age of citizen's has risen substantially. A key factor contributing to this trend is an increase in life expectancy across Europe and North America since the end of the Second World War, which has caused the average age of the people of Europe and North America to rise. In 2018, it was reported that the median age across the EU was over 43 years old,[31] with projections to rise to 46.9 years by 2050.
It is worth noting that the median age of the Western World is suppressed to a degree by the presence of non-White populations who have a substantially lower median age than the White population.
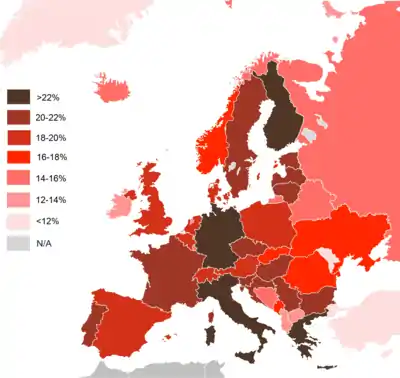
Population ageing in the Western world has been cited by high level institutions as a big reason and desire for increased immigration to Europe, North America and Oceania. For example, a UN report in 2000 entitled "Replacement Migration: Is It a Solution to Declining and Ageing Populations?" suggested increased migration as a solution to population ageing in numerous first world countries, such as Japan, Korea, Russia, the United Kingdom and the United States, for example.[32][33] Other figures, such as Peter Sutherland (former head of Global Forum on Migration and Development) in 2012 also lobbied for utilizing mass migration for the purpose of "undermining national homogeneity of its member states (...), for the development of multicultural states" as a "crucial dynamic for economic growth (...) however difficult it may be to explain this to the citizens of those states" in the European Union, and that if they did not, the "EU's ability to compete at a global level was at risk."[34]
| Country | Median Age (projections 2021+) | ||||||||
|---|---|---|---|---|---|---|---|---|---|
| 1950 | 1975 | 2000 | 2015 | 2020 | 2025 | 2050 | 2075 | 2100 | |
.png.webp) Austria Austria |
35.7 | 33.9 | 38.2 | 43.2 | 44.4 | 45.3 | 49.9 | 49.2 | 49.4 |
.svg.png.webp) Australia Australia |
30.4 | 28.1 | 35.4 | 37.4 | 37.9 | 38.9 | 41.5 | 44.1 | 46.7 |
.svg.png.webp) Belgium Belgium |
35.5 | 34.3 | 39 | 41.3 | 41.8 | 42.6 | 44.7 | 45.7 | 47.1 |
 Canada Canada |
27.7 | 27.5 | 36.8 | 40.5 | 41.4 | 42.4 | 45.2 | 46.5 | 47.7 |
 Denmark Denmark |
31.7 | 33 | 38.4 | 41.6 | 42.3 | 42.4 | 44.2 | 45.1 | 46.7 |
.svg.png.webp) France France |
34.7 | 31.8 | 37.7 | 41.2 | 42 | 42.6 | 44.3 | 45.4 | 47.3 |
 Germany Germany |
35.2 | 35.4 | 40.1 | 45.9 | 46.6 | 47.1 | 50.3 | 49.2 | 50 |
 Ireland Ireland |
30 | 26 | 31.8 | 36.9 | 38.7 | 40.3 | 42.6 | 44.7 | 47.5 |
 Italy Italy |
28.6 | 33.4 | 40.4 | 45.9 | 47.9 | 49.7 | 51.4 | 49.8 | 50.5 |
 Netherlands Netherlands |
28 | 29.4 | 37.5 | 42.1 | 43.2 | 43.9 | 46.8 | 47.5 | 48.7 |
 New Zealand New Zealand |
29.4 | 26.3 | 34.3 | 37.3 | 37.9 | 38.7 | 43.1 | 46.3 | 48.6 |
.svg.png.webp) Norway Norway |
32.6 | 32.4 | 36.9 | 39.2 | 39.7 | 40.3 | 43.2 | 45.1 | 47.1 |
 Russia Russia |
24.3 | 30.8 | 36.5 | 38.7 | 39.6 | 41 | 41.4 | 42.1 | 43.9 |
 Spain Spain |
27.5 | 29.9 | 37.6 | 43.2 | 45.5 | 47.9 | 52.3 | 51.3 | 51.7 |
 Sweden Sweden |
34.2 | 35.4 | 39.4 | 40.9 | 41 | 41.3 | 43.2 | 44.9 | 46.5 |
.svg.png.webp) United Kingdom United Kingdom |
34.9 | 34 | 37.2 | 40.2 | 40.8 | 41.5 | 43.9 | 45.8 | 47.7 |
 United States United States |
30.2 | 29 | 35.2 | 37.6 | 38.3 | 39 | 42 | 43.8 | 45.3 |
Fertility
According to the 2019 National Vital Statistics Reports, published by the CDC's National Center for Health Statistics (NCHS), the average fertility rate in the United States varies significantly by race and ethnicity.[36] The average fertility rate as of 2019 was 1,665.5 births per 1,000 women for non-Hispanic whites, 1,824.5 births per 1,000 women for non-Hispanic blacks, and 2,006.5 births per 1,000 women for Hispanics.[36] It is also common to see these figures represented as, for example, "1.6 births-per-woman", rather than 1,665 births per 1,000 women. The report duly notes that "Replacement level fertility is a total fertility rate of 2,100.0 births per 1,000 women."[36] The extra 100 births are required to accommodate for any premature death or disability that may befall the children before they go through puberty and are able to have their own children.
There are notable differences in birthing patterns and behaviors between ethnic groups. For example, African women are more likely to have twins than any other race, while Asians and Native Americans have the lowest twinning rates.[37]
There is an important spectrum of fertility to consider with regards to ethnicity and fertility, known as r/K selection theory. This theory describes a trade-off between quantity and quality of offspring that can be seen across all species of organism on the planet: some species are focused on either an increased quantity of offspring at the expense of parental investment (r-strategists), and some species are focused on a reduced quantity of offspring with a corresponding increased parental investment (K-strategists). Each strategy, r and K, are evolved by a given organism to promote success in their particular environment. Human beings overall are K-strategists, but within their own K-strategy one can observe an r/K paradigm.
A study published in the Official Journal of the American Academy of Pediatrics reported that "US and South American-born black mothers had a consistently higher risk of low birth weight infants, regardless of community income level."[38] According to world-renowned Canadian psychologist and researcher J. Phillippe Rushton, "Africa is warmer than the northern continents, but it is a less stable habitat. Droughts, storms, and diseases from viruses, bacteria, and parasites cause high death rates, even today. Without modern medical care, insuring survival in Africa means having many young (r-strategy). In the more stable environments of Europe and Asia, survival is insured from having fewer young, but caring for them very well (K-strategy)."[39]
Immigration
A 2017 report from the United Nations titled "World Population Prospects: Key Findings and Advance Tables" states that "between 1950 and 2015, the regions of Europe, Northern America and Oceania were net receivers of international migrants, while Africa, Asia and Latin America and the Caribbean were net senders, with the volume of net migration generally increasing over time."[6]
The United States is a prime example of how mass migration causes white demographic decline. With the passing of the Hart-Celler Act of 1965, the previous Johnson-Reed Act of 1924 was rendered null and void. This means that the US could no longer discriminate against immigrants based on their country of origin. For example, immigrants from Haiti or the Philippines could not be treated any differently under the law than immigrants from Switzerland or Norway due to their country of origin.
Emigration
Emigration also contributes to overall white demographic decline of a population group, either nationally or regionally.
White flight
In regional area's and jurisdictions, white flight, which is the phenomenon of a massive decline in the white population in a small period of time, can occur to some degree of extent when the ethnic minority population of any race rises in substantial numbers. A famous example of this is in Detroit, where the Non-Hispanic White population dropped from 90.72% in 1940 to 12.36% in 2000.
Analytical terms
Majority minority
As well as referencing ethno-cultural, linguistic, and religious demography, the term "majority minority" has consistently been used in racial contexts in media and academia, and specifically to identify the demographic decline of white populations. In 2010, it was reported by the BBC how "America's two largest states – California and Texas – became "majority-minority" states (with an overall minority population outnumbering the white majority)" between 1998 and 2004.[12]
Demographers Rogelio Sáenz and Dudley L. Poston Jr. have studied existing states which have gained white minorities in the 21st century, and how, from 2017 onwards, an ongoing falling white population-share predicts further US states to follow this trend: "Nonwhites account for more than half of the populations of Hawaii, the District of Columbia, California, New Mexico, Texas and Nevada. In the next 10 to 15 years, these half-dozen "majority-minority" states will likely be joined by as many as eight other states where whites now make up less than 60 percent of the population." From their research, Sáenz and Poston Jr. expect the United States to have progressed to overall white minority demography by 2044.[40] Regarding various projected majority minority scenarios across the Western world, in a 2018 article for the London School of Economics, academics Eric Kaufmann and Matthew Goodwin wrote:[41]
The ethnic make-up of many western countries is changing, and in countries previously seen as having 'white' majorities that past predominance is declining. In the United States, Canada and New Zealand, the 'majority-minority' point will arrive around 2050, while in western Europe it is projected to occur towards the end of the century. Some commentators have asked if this change may lead to a growing reaction or 'white backlash'. All else being equal, we suggest that the answer may be yes.
An example from the developing world includes Brazil which, due to a long-term demographic decline of white Brazilians, has been designated as a majority-minority country in relation to the South American nation's racial classification of whiteness.[13]
Racial shift condition
In their widely cited research, professors Jennifer Richeson and Maureen Craig produced a 2014 study on white racial shift conditions.[42] White people who were informed of their diminishing demographic share of the population displayed more racial hostility to perceived external racial groups.[43] Pacific Standard described the research as how "the coming racial shift evokes higher levels of both explicit and implicit racism on the part of white Americans".[44] In analysis of the study, sociologist Mary C. Waters concurred that the portrayal in media of falling white demography was linked with subsequent discrimination against non-whites.[45]
Whiteshift
Demographer Eric Kaufmann's theory of whiteshift predicts that as white demographic decline gradually results in white majorities becoming minorities (sometimes called a majority minority scenario) that a broader and more inclusive classification of white people will occur.[46][47] A professor of politics at Birkbeck College, he suggests that, given the appropriate societal conditions, both conservatives and cosmopolitans may be able to observe whiteshift as a positive factor.[48] In this regard, political analyst Michael Barone believes there may be "cautious optimism" that the social phenomenon can progress in a politically stable form.[49]
Analysing Kaufmann's thesis, historian Michael Burleigh has used examples of whiteshift such as Western politicians Iain Duncan Smith, Geert Wilders and Ted Cruz, who have some degree of what might be considered non-white or ethnic minority ancestry in their respective countries.[50] Demographer Dowell Myers has also referenced Cruz and Megan Markle as examples, claiming that "whites are indeed in numerical decline" in the United States, when judged upon a criterion of exclusively European ancestry.[51]
Demography by country
Statistical factors
Australia
As of 2020, 29.8% of Australia's population was born overseas.[52]
Statistical factors
Classification on ethnicity
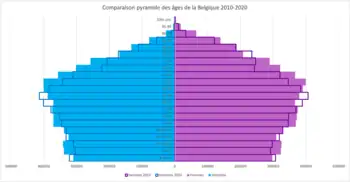
As Belgium does not keep data on the race and religion of the country's population[53], Demographic classifications are instead taken from a persons nationality and their parents nationality. Statistics Belgium has devised three major classifications for the ethnicity and origin, based on the current and first registered nationality of both parents individually, of Belgium's population;[54]
- Belgian with Belgian parents;
- Belgian with/of foreign parents; a. i. One parent with foreign first registered nationality; ii. Both parents with foreign first registered nationality; b. Foreign first registered nationality.
- Non-Belgian
The Belgian's with or of foreign background can be divided in half;
- 49.7% do not have Belgian nationality as their first registered nationality but have acquired it in the meantime.
- 50.3% have Belgian nationality as first registered nationality, including: 20.3% have both parents with a foreign first registered nationality; 30.0% have one parent with a foreign first registered nationality.
In addition to classifications for ethnicity and origin, the nationality of origin was also registered. The following nationality classifications are as follows;
- Belgian's (only people in the group of origin Belgian with Belgian background);
- Neighboring country: Germany, France, the Netherlands, the Grand Duchy of Luxembourg and the United Kingdom are considered as neighboring countries;
- EU27 (excluding Belgium and the neighbouring countries);
- Outside EU27 (excluding neighbouring countries).
Demographic statistics
Ethnic group origins of Belgium
Source: Statistics Belgium – 2021
As of 2021, 67.3% of Belgium was of only Belgian ancestry, 20.1% was Belgian with/of foreign ancestry and 12.6% was non-Belgian. The demography of the country varied from region to region, in Flanders 75% of the population were Belgians, in Wallonia this went down to 66% and in Brussels this sank down to just a quarter of the population.[54][55]
| Ethnic Group | 2021[54] | |
|---|---|---|
| Number | % | |
| Belgians | 7,753,000 | 67.3% |
| Belgians with at-least one foreign parent | 2,320,385 | 20.1% |
| Non-Belgians | 1,447,853 | 12.6% |
Statistical factors
.jpg.webp)
Classification on ethnicity
Statistics Canada classifies the White population in Canada on two criteria regarding race[56];
- That the person is not someone who falls under the Employment Equity Act's 'Visible Minority' category and defines this as "persons, other than Aboriginal peoples, who are non-Caucasian in race or non-white in colour.". This category includes a broad range of groups, these are; South Asians, Chinese, Blacks, Filipino, Latin Americans, Arab, Southeast Asians, West Asians, Koreans, Japanese, Visible minority, n.i.e. ('n.i.e.' means 'not included elsewhere') and Multiple visible minorities (mixed race non-White).
- Not an Aboriginal
Demographic statistics
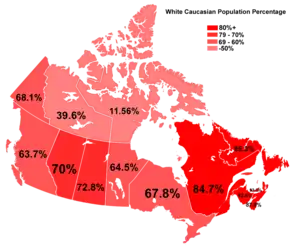
Demography wise White Canadians are, as of the Canadian 2016 Census, 72% of the population.
Demographic predictions as to when white Canadians will be a minority differ, In 2018, scholars Eric Kaufmann and Matthew Goodwin wrote that the demographic process would result in white Canadians being in the minority by around 2050[41] however Statistics Canada in 2017 has also concluded that it could be even as soon as 2036.[57][58][59]
| Ethnic Groups | 1996[60][61] | 2001[62] | 2006[63] | 2011[64] | 2016[65] | 2021 | ||||||
|---|---|---|---|---|---|---|---|---|---|---|---|---|
| Visible Minority population | ||||||||||||
| Number | % | Number | % | Number | % | Number | % | Number | % | Number | % | |
| Total: | 3,197,485 | 11.2% | 3,983,845 | 13.4% | 5,068,095 | 16.2% | 6,264,750 | 19.1% | 7,674,580 | 22.3% | ||
| South Asian | 670,590 | 2.32% | 917,070 | 3.1% | 1,262,865 | 3.99% | 1,567,400 | 4.8% | 1,924,635 | 5.6% | ||
 Chinese Chinese |
860,150 | 2.98% | 1,029,395 | 3.5% | 1,216,565 | 3.84% | 1,324,750 | 4% | 1,577,060 | 4.6% | ||
| Black | 573,860 | 1.98% | 662,215 | 2.2% | 783,795 | 2.47% | 945,665 | 2.9% | 1,198,540 | 3.5% | ||
 Filipino Filipino |
234,195 | 0.81% | 308,575 | 1% | 410,695 | 1.29% | 619,310 | 1.9% | 780,125 | 2.3% | ||
| Latin American | 176,970 | 0.61% | 216,980 | 0.72% | 304,245 | 0.96% | 381,280 | 1.2% | 447,325 | 1.3% | ||
| Arab | – | – | 194,685 | 0.64% | 265,550 | 0.84% | 380,620 | 1.2% | 523,235 | 1.5% | ||
| Southeast Asian | 172,765 | 0.59% | 198,880 | 0.66% | 239,935 | 0.75% | 312,075 | 0.9% | 313,260 | 0.9% | ||
| West Asian | – | – | 109,285 | 0.36% | 156,700 | 0.49% | 206,840 | 0.6% | 264,305 | 0.8% | ||
| Arab/West Asian | 244,665 | 0.84% | – | – | – | – | – | – | – | – | – | – |
 Korean Korean |
64,835 | 0.22% | 100,660 | 0.33% | 141,890 | 0.44% | 161,130 | 0.5% | 188,710 | 0.5% | ||
 Japanese Japanese |
68,135 | 0.23% | 73,315 | 0.24% | 81,300 | 0.25% | 87,270 | 0.3% | 92,920 | 0.3% | ||
| Visible minority, n.i.e | 69,745 | 0.24% | 98,915 | 0.32% | 71,420 | 0.22% | 106,475 | 0.3% | 132,090 | 0.4% | ||
| Multiple visible minorities | 61,575 | 0.21% | 73,875 | 0.24% | 133,120 | 0.42% | 171,935 | 0.5% | 232,375 | 0.7% | ||
| non-Visible Minority population | 25,330,645 | 88.8% | 25,655,185 | 86.6% | 26,172,935 | 83.8% | 26,172,935 | 83.8% | 26,785,480 | 77.7% | ||
| Aboriginal | 799,005 | 2.8% | 976,305 | 3.2% | 1,172,785 | 3.7% | 1,400,685 | 4.3% | 1,673,785 | 4.9% | ||
| White Caucasians | 24,850,271 | 86% | 25,046,944 | 83.4% | 25,372,017 | 80.1% | 25,186,890 | 76.7% | 25,111,695 | 72.9% | ||
| Total population: | 28,846,761 | 100% | 30,007,094 | 100% | 31,612,897 | 100% | 32,437,685 | 100% | 34,460,060 | 100% | ||
| Province/territory | 2001 | 2006 | 2011 | 2016 | ||||
|---|---|---|---|---|---|---|---|---|
| Population (2001) | % of total population | Population (2006) | % of total population | Population (2011) | % of total population | Population (2016) | % of total population | |
 Ontario Ontario |
8,944,190 | 79.3% | 9,041,200 | 75.2% | 9,070,795 | 71.7% | 8,982,180 | 67.8% |
 Quebec Quebec |
6,548,205 | 91.9% | 6,673,120 | 89.7% | 6,740,370 | 87.2% | 6,750,200 | 84.7% |
 British Columbia British Columbia |
2,862,405 | 74.0% | 2,869,450 | 70.4% | 2,911,568 | 67.3% | 2,908,420 | 63.8% |
 Alberta Alberta |
2,455,005 | 83.5% | 2,613,790 | 80.3% | 2,690,955 | 75.4% | 2,786,340 | 70.0% |
 Manitoba Manitoba |
866,545 | 78.5% | 849,025 | 74.9% | 824,820 | 70.2% | 800,540 | 64.5% |
 Nova Scotia Nova Scotia |
846,030 | 94.3% | 841,230 | 93.2% | 825,050 | 91.1% | 798,195 | 87.9% |
 Saskatchewan Saskatchewan |
805,380 | 83.6% | 778,060 | 81.2% | 787,745 | 78.1% | 779,665 | 72.8% |
 New Brunswick New Brunswick |
693,295 | 96.3% | 688,650 | 95.7% | 696,085 | 94.6% | 676,785 | 92.6% |
 Newfoundland and Labrador Newfoundland and Labrador |
485,450 | 95.6% | 471,430 | 94.2% | 464,540 | 91.6% | 454,710 | 88.8% |
 Prince Edward Island Prince Edward Island |
130,860 | 98.1% | 130,645 | 97.4% | 130,885 | 95.3% | 130,310 | 93.3% |
 Yukon Yukon |
20,955 | 73.5% | 21,395 | 70.9% | 23,595 | 70.8% | 23,915 | 68.1% |
 Northwest Territories Northwest Territories |
16,925 | 45.4% | 18,150 | 44.2% | 16,915 | 41.6% | 16,320 | 39.7% |
 Nunavut Nunavut |
3,735 | 14.0% | 3,990 | 13.6% | 3,820 | 12.1% | 4,115 | 11.6% |
| Canada |
24,678,880 | 83.3% | 25,000,150 | 80.0% | 25,186,890 | 76.7% | 25,111,695 | 72.9% |
Regionally, as of the 2016 census, Toronto is currently the only city that is majority non-white.
Statistical factors
Statistical factors
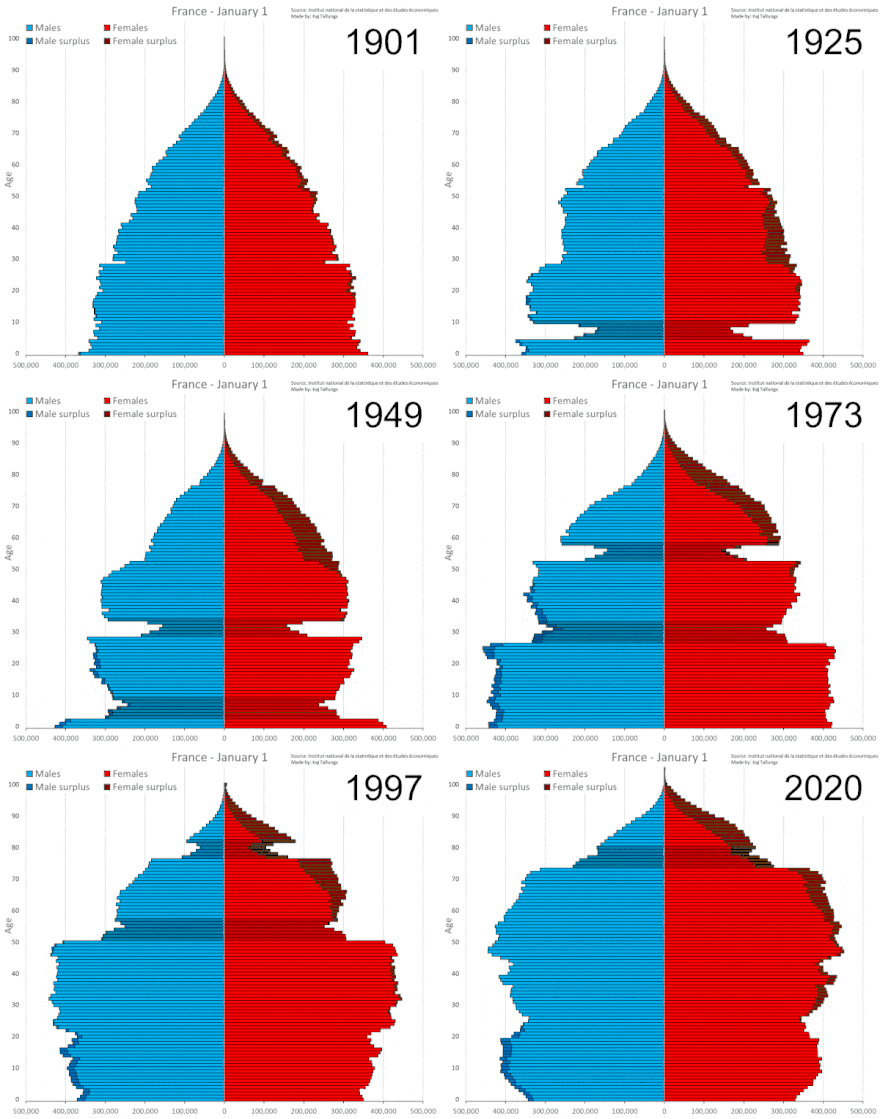
Background
.svg.png.webp)
During the 1980s in Germany, Chancellor Helmut Kohl had plans to reduce the Turkish population in Germany by half within four years,[66] in 1983 the government passed the Return Assistance Act (Das Rückkehrhilfegesetz) which was intended to promote the repatriation of unemployed foreigners in Germany, however by June 1984 the law had no practical relevance in relation to financial benefits and only 150,000 foreign workers used the program by September 1984, of those 100,000 of them were Turk's.[66]
Statistical factors
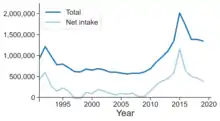 Total number of immigrants moving to Germany annually, along with net intake (i.e. after subtracting those moving back to their home countries). Does not include German citizens moving to/from Germany. 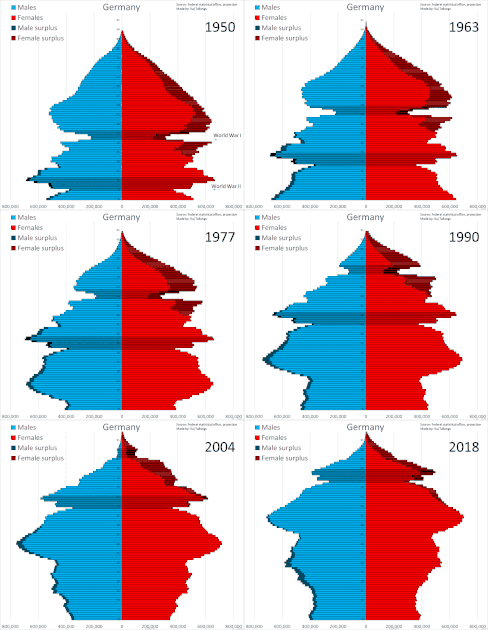 Population Pyramid of Germany from 1950 to 2018 |
|---|
Regional demography
As of 2021 in Germany, regionally Frankfurt is currently the only city in the country in which ethnic Germans are a minority of the residents.[67]
Statistical factors
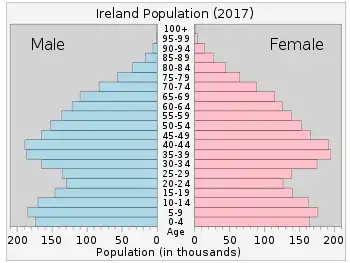
Demographic Statistics
Demographics of Ireland (2016)
Source: Central Statistics Office Census 2016
Demography wise, as of 2016 Census data from the Central Statistics Office, people who identify as 'White Irish' are currently 82% of the population.[68][69]
| Ethnic Group | 2011[68] | 2016[68][69] | ||
|---|---|---|---|---|
| Number | % | Number | % | |
| White: Total | 4,264,465 | 94.24% | 4,331,940 | 92.37% |
| White Irish |
3,821,995 | 84.46% | 3,854,226 | 82.2% |
| Other White | 412,975 | 9.13% | 446,727 | 9.5% |
| Irish Traveller | 29,495 | 0.65% | 30,987 | 0.7% |
| Asian: Total | 84,690 | 1.87% | 98,720 | 2.10% |
| Chinese |
17,832 | 0.39% | 19,447 | 0.4% |
| Other Asian | 66,858 | 1.48% | 79,273 | 1.7% |
| Black: Total | 65,078 | 1.44% | 64,639 | 1.38% |
| Black Irish and Black African | 58,697 | 1.30% | 57,850 | 1.4% |
| Other Black | 6,381 | 0.14% | 6,789 | 0.12% |
| Other and Not Stated | 111,048 | 2.45% | 194,622 | 3.98% |
| Total: | 4,525,281 | 100% | 4,689,921 | 100% |
Majority-minority predictions
In an article written in 2005 in the Irish Times, then President of Dublin City University, Professor Ferdinand von Prondzynski suggested that by 2050 the 'indigenous Irish' could be a minority within the country stating that 'Ireland's population will consist of a multicultural and multi-ethnic mix in which the indigenous Irish will form a minority.'[70]
Statistical factors

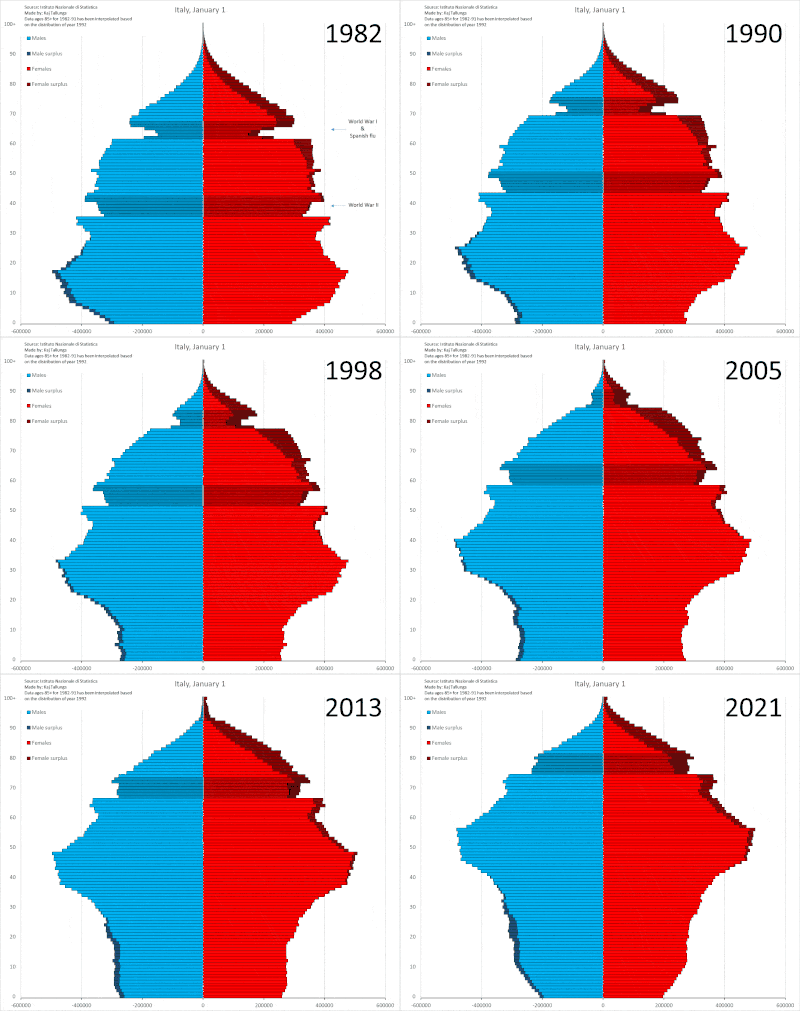
Statistical factors
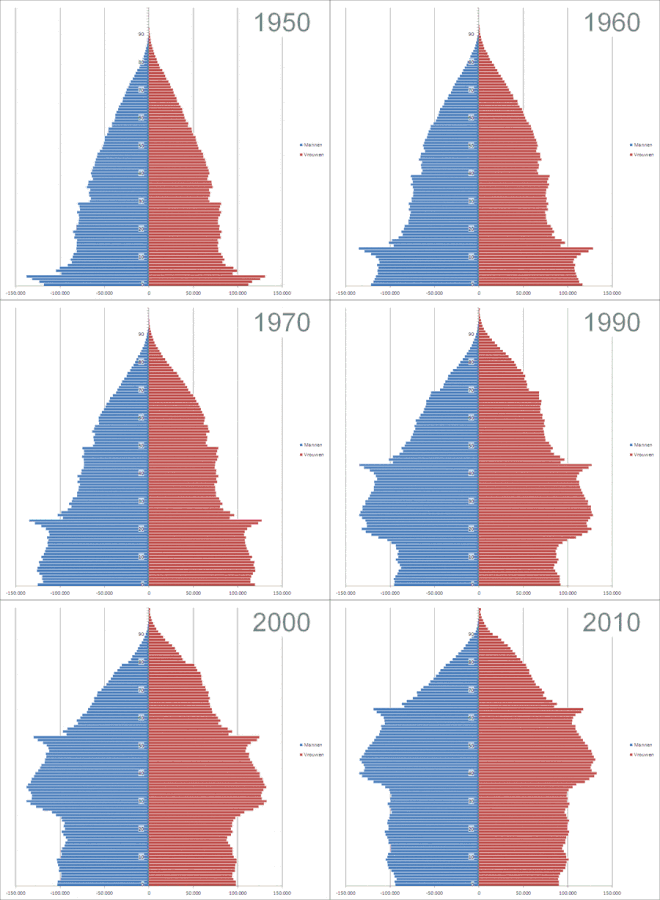
Demographic statistics
As of 2021, the Dutch population in the Netherlands currently sits at 75.36% of the population, with Turks (2.41%), Moroccans (2.37%) and Surinamese (2.05%) being the three biggest groups afterwards[71]
Demography of the Netherlands as of 2021
Source: StatLine Population; gender, age, generation and migration background, January 1
| Ethnic Group | 1996[71] | 2001[71] | 2006[71] | 2011[71] | 2016[71] | 2021[71] | ||||||
|---|---|---|---|---|---|---|---|---|---|---|---|---|
| Number | % | Number | % | Number | % | Number | % | Number | % | Number | % | |
| Dutch |
12,995,174 | 83.87% | 13,116,851 | 82.04% | 13,186,595 | 80.72% | 13,228,780 | 79.42% | 13,226,829 | 77.9% | 13,169,507 | 75.36% |
 Turks Turks |
271,514 | 1.75% | 319,600 | 1.99% | 364,333 | 2.23% | 388,967 | 2.33% | 397,471 | 2.34% | 422,030 | 2.41% |
 Moroccans Moroccans |
255,088 | 1.64% | 272,752 | 1.70% | 325,239 | 1.99% | 355,883 | 2.13% | 385,761 | 2.27% | 414,186 | 2.37% |
 Indonesians Indonesians |
411,622 | 2.65% | 403,894 | 2.52% | 393,057 | 2.4% | 380,047 | 2.28% | 366,849 | 2.16% | 352,266 | 2.01% |
 Surinamese Surinamese |
280,615 | 1.81% | 308,824 | 1.93% | 331,890 | 2.03% | 344,734 | 2.06% | 349,022 | 2.05% | 358,266 | 2.05% |
| Germans |
411,504 | 2.65% | 398,776 | 2.49% | 383,841 | 2.34% | 378,581 | 2.27% | 360,116 | 2.12% | 345,746 | 1.98% |
 Poles Poles |
25,125 | 0.16% | 30,600 | 0.19% | 45,402 | 0.27% | 87,323 | 0.52% | 149,831 | 0.88% | 209,278 | 1.20% |
| Other | 843,247 | 5.44% | 1,135,778 | 7.10% | 1,330,853 | 8.14% | 1,491,484 | 8.95% | 1,743,241 | 10.26% | 2,204,136 | 12.61% |
| non-Dutch | 2,498,715 | 16.13% | 2,870,224 | 17.96% | 3,174,615 | 19.28% | 3,427,019 | 20.68% | 3,752,291 | 22.1% | 4,305,908 | 24.63% |
| Total: | 15,493,889 | 100% | 15,987,075 | 100% | 16,334,210 | 100% | 16,655,799 | 100% | 16,979,120 | 100% | 17,475,415 | 100% |
Regional demographics
Regionally, in bigger cities such as Amsterdam, the ethnic Dutch resemble just under a minority of the population there however in relation to under 15's children of Dutch parentage only resemble 1/3rd of the youth in the city.[72] In Rotterdam and The Hague, the same is present in which the ethnic Dutch resemble around 46%, a minority, of the population.
Majority-minority predictions
David Coleman, a demography professor, projects that by the end of the century on projected current trends, that the Netherlands would have a 'majority foreign origin population'[26]
New Zealand
As of 2013, New Zealand registered a European population percentage of 74% with Māori (14.9%), Asians (11.8%) and Pacific Islanders (7.4%) totaling as the next 3 largest groups.[73]
Statistical factors
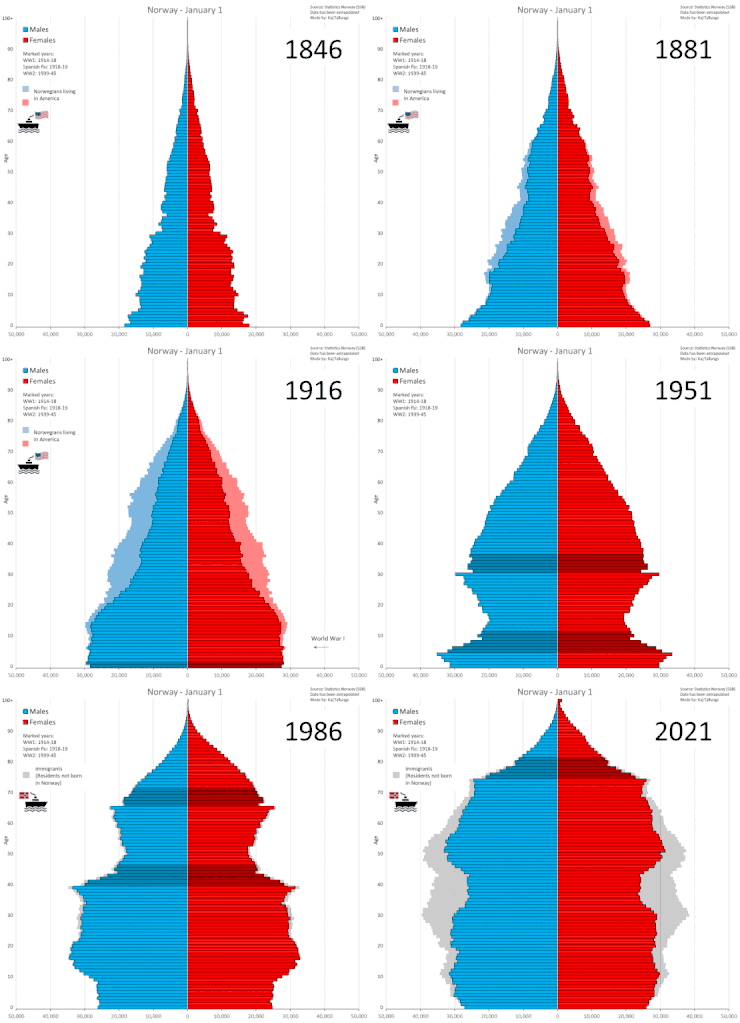
Sweden
David Coleman, a demography professor, projects that by the end of the century on projected current trends, that Sweden would have a 'majority foreign origin population'[26]
Statistical factors
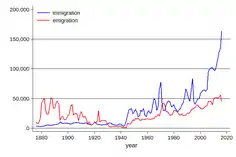
Regional demographics
Regionally, in Malmö, ethnic Swede's make up around 45% of the population of the city while foreign-born populations with at least one foreign-born parent made up around 55% of the city's population.[74]
Background
White British people have been in period of demographic decline ever since the late 1940s when non-white immigration to the country began, it is estimated numerically that the number of non-Whites living in Britain in the year 1950 was no more than 20,000, who were primarily located in England, however by the time of the mid-1960's; this number has risen to nearly 1,000,000. This can in part be explained to relaxed immigration laws to allow the country to have access to a bigger labour force after the end of the Second World War and very loose definition and criteria for who would be classed as a 'United Kingdom citizen', especially in regards to the British Nationality Act of 1948.
The initial mass immigration wave of the middle and late 20th century to the United Kingdom plateaued and stayed capped at around 50,000 every year by the 1960s, however in 1997, this had been changed by Tony Blair who had eased up restrictions on immigration for a variety of reasons; one such example of this was when in 1997 the Labour Government dropped the Primary Purpose rule which had barred many immigrants from coming to the United Kingdom due to restrictions on family reunions as it could be abused.[75] It has been said of the period of migration from 1997 to 2010 has been 'one of the largest in British peace time history', numerically the ethnic minority population doubled in size from around 4 million to 8 million, the Lord Hodgson of Astley Abbotts said that;
in each year between 2004–10 there were more immigrants to the United Kingdom than there were in the whole period between 1066 and 1945. There were more immigrants in each year than there were in nine centuries.[76]
Statistical factors
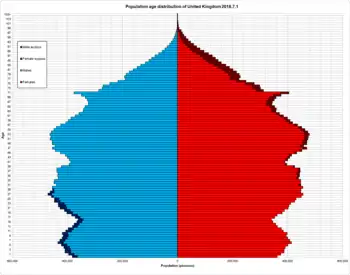 Population Pyramid of the United Kingdom in 2018  Migration to and from the United Kingdom with net figures included[77] |
|---|
Classification on ethnicity
From each census, The Office of National Statistics has changed their way of classifying the overall immigrant population into different groups, the classifications from each census are as follows[78];
- 1966 sample Census – ONS classified the immigrant population into three groups based purely on nationality over ethnicity; the Old Commonwealth (Australia, Canada and New Zealand), the New Commonwealth (including India, Pakistan, Bangladesh and the West Indies), the African Commonwealth (including Nigeria, Uganda and Kenya).
- 1971 until well into the 1980's – Interviewers were asked to judge whether someone was White or 'coloured', 1971 Census and 1981 Census did not include a question on ethnicity specifically and went with nationality classifications from beforehand.
- 1991 Census – Ethnicity is asked for the first time as a proper question on the census, the classifications on the census were as follows: White; Black-Caribbean; Black-African; Black-Other; Indian; Pakistani; Bangladeshi; Chinese; Any other ethnic group.
- 2001 Census – Mixed ethnicity was added to the census, 'Asian British' and 'Black British' added as well. White British and Irish is also added as a additional clarification for White respondents
- 2011 Census – 'Black or Black British' changed to ‘Black/African/Caribbean/Black British’, two new categories added for England, Wales and Scotland, those being ‘Gypsy or Irish Traveller’ and ‘Arab’.
- 2021 Census – Addition of a tickbox for the 'Roma' population group.
Demographic statistics
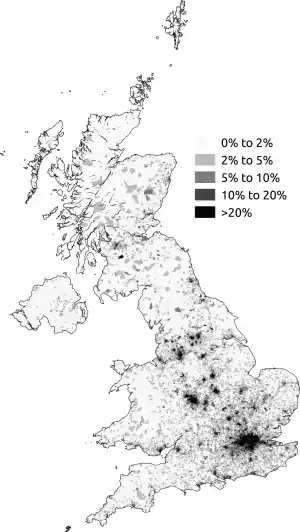
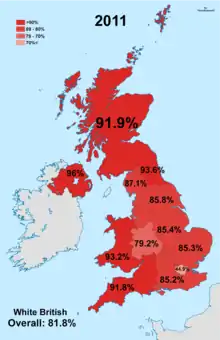
Demography wise, the White British population of the United Kingdom stands at currently as of the 2011 census at 83%, in specifically England, who receives 90% of the United Kingdom's immigration this percentage drops down to 79% in 2011 from 87% in 2001.
| Ethnic Group | 1991[79] | 2001[80][81][82] | 2011[83] | |||
|---|---|---|---|---|---|---|
| Number | % | Number | % | Number | % | |
| White: Total | 53,415,915 | 94.65% | 54,153,898 | 92.12% | 55,073,552 | 87.17% |
| White: British |
52,037,485 | 88.52% | 51,736,290 | 81.88% | ||
| White: Irish |
837,464 | 1.48% | 691,232 | 1.18% | ||
| White: Gypsy / Traveller / Irish Traveller | – | – | 1,710 | – | 63,193 | 0.1% |
| White: Other | 1,423,471 | 2.42% | ||||
| Asian: Total | 1,834,117 | 3.25% | 2,578,826 | 4.39% | 4,373,339 | 6.3% |
 Asian / Asian British: Indian Asian / Asian British: Indian |
840,255 | 1.48% | 1,053,411 | 1.79% | 1,451,862 | 2.3% |
 Asian / Asian British: Pakistani Asian / Asian British: Pakistani |
476,555 | 0.84% | 747,285 | 1.27% | 1,174,983 | 1.9% |
 Asian / Asian British: Bangladeshi Asian / Asian British: Bangladeshi |
162,835 | 0.28% | 283,063 | 0.48% | 451,529 | 0.7% |
| Asian / Asian British: Chinese |
156,938 | 0.27% | 247,403 | 0.42% | 433,150 | 0.7% |
| Asian / Asian British: Other Asian | 197,534 | 0.35% | 247,664 | 0.42% | 861,815 | 1.4% |
| Black: Total | 890,727 | 1.57% | 1,148,738 | 1.95% | 1,904,684 | 3.0% |
| Black: African | 212,362 | 0.37% | 485,277 | 0.83% | ||
| Black: Caribbean | 499,964 | 0.88% | 565,876 | 0.96% | ||
| Black: Other Black | 178,401 | 0.31% | 97,585 | 0.17% | ||
| British Mixed | – | – | 677,117 | 1.15% | 1,250,229 | 2.0% |
| Other: Total | 290,206 | 0.51% | 230,615 | 0.39% | 580,374 | 0.9% |
| New Commonwealth | – | – | – | – | – | – |
| Total: | 56,430,965 | 100% | 58,789,194 | 100% | 63,182,178 | 100% |
Increasingly, in live births, a phenomenon of 'diversification' is also occurring. Historically, non-White ethnic groups which reside within the United Kingdom have always had an very high fertility rate compared to the indigenous population, As of recently the fertility rates of all groups has declined however non-White ethnic populations are usually much younger on average than their White counterparts and still consistently have a slightly higher fertility rate of 1.97 TFR (total fertility rate) than the indigenous population which sits at 1.57, furthermore there has been an increase of births from foreign-born mothers as well, which account for 28.7% of births in the country,[84] Due to the aforementioned population ageing of the White British population, this has began to create a more ethnically diverse youth population in the United Kingdom. This can be seen especially in big urban areas such as: London, Manchester, Leicester, Slough and Cambridge for example, in which births to the indigenous White British are a minority.
Live births in England and Wales
Source: ONS 2019
| 2019[84] | ||
|---|---|---|
| Ethnic Group | Number | % |
| White: British |
374,056 | 58.45% |
| White: Other | 78,192 | 12.22% |
| White: Total | 452,248 | 70.67% |
| Asian / Asian British: Indian |
20,627 | 3.22% |
| Asian / Asian British: Pakistani |
27,573 | 4.31% |
| Asian / Asian British: Bangladeshi |
9,505 | 1.49% |
| Asian: Total | 57,705 | 9.02% |
| Black: African | 21,589 | 3.37% |
| Black: Caribbean | 5,480 | 0.86% |
| Black: Total | 27,069 | 4.23% |
| Other: Total | 77,387 | 12.09% |
| Not Stated | 25,578 | 4.00% |
| Total: | 639,987 | 100% |
Regional statistics
Regionally, a small number of cities and towns in the United Kingdom have became majority non-White British in recent years, as of the 2011 census, London (44.9% White British)[85], Leicester (45.1% White British) and Slough (34.5% White British), where White British are a minority. Other towns are also projected either currently, or in the future to have White British minorities. Birmingham and Luton are expected to become minority-White British by the 2021 UK Census, other cities and towns such as Milton Keynes, Nottingham, Peterborough and Coventry for example are expected to have major demographic shifts in the future which will make these places majority-minority.[86]
Minority predictions
In 2013, Demos published research analyzing the 2011 United Kingdom census. The UK-based think tank detailed how "departing white British are replaced by immigration or by the natural growth of the minority population. Over time, the end result of this process is a spiral of white British demographic decline".[87]
Academic David Coleman has produced research which demonstrates that the cities of Leicester and Birmingham will join London in their majority minority status during the 2020s, with regards to the demographic decline of White people in Britain.[88] Coleman, a University of Oxford demography professor since 1980, estimates that by 2056, the trend of a declining share of the white populace will result in the United Kingdom having an overall white minority.[89]
Background
White demographic decline in the United States has been occurring relatively since the passing of Immigration and Nationality Act of 1965, also known as the Hart-Celler Act, this bill drastically changed immigration to America and removed provisions off of the Immigration Act of 1924 which barred Immigration from Asia and set-quotas from those outside of the Western Hemisphere. A contemporary term for this process is called the 'browning of America'[90][91]
The 2020 Census results also began to show a new trend within the United States, as previous census results had shown a decline in the percentage of White Americans nationally but not a decline in actual numbers, however, the new census had shown that for the first time both had actually occurred.[92]
Statistical factors
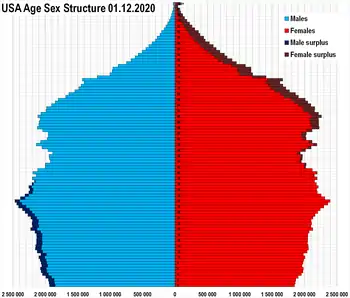
Classification on race
The 2000 U.S. census states that racial categories "generally reflect a social definition of race recognized in this country. They do not conform to any biological, anthropological or genetic criteria." The U.S Census classification of 'White' encompasses many different ethnic groups but generally denotes someone of European ethnicity, ancestry and race, however legally, West Asian's, Arab Americans and North African's are considered White as well.[93]
The United States Census Bureau classifies the population of the United States into several racial groups:
- White – A person having origins in any of the original peoples of Europe, the Middle East, or North Africa.
- Black or African American – A person having origins in any of the Black racial groups of Africa.
- American Indian or Alaska Native – A person having origins in any of the original peoples of North and South America (including Central America) and who maintains tribal affiliation or community attachment.
- Asian – A person having origins in any of the original peoples of the Far East, Southeast Asia, or the Indian subcontinent including, for example, Cambodia, China, India, Japan, Korea, Malaysia, Pakistan, the Philippine Islands, Thailand, and Vietnam.
- Native Hawaiian or Other Pacific Islander – A person having origins in any of the original peoples of Hawaii, Guam, Samoa, or other Pacific Islands.[94]
The Census allows for people of mixed race heritage to report themselves of two racial groups.
The United States Census Bureau states that 'An individual’s response to the race question is based upon self-identification. The Census Bureau does not tell individuals which boxes to mark or what heritage to write in.'[94]
Demographic statistics
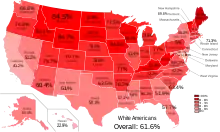
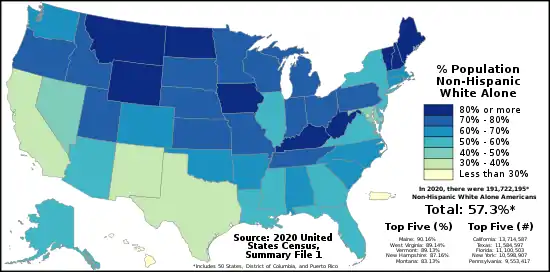
The results of the 2020 United States census showed a 8.6% decline in the white population when compared to 10 years prior, which is the first time that there has been a drop in white population numbers since the country's founding.[96]
| State/Territory | 1990 | 2000 | 2010 | 2020 | ||||
|---|---|---|---|---|---|---|---|---|
| Pop | % pop | Pop | % pop | Pop | % pop | Pop | % pop | |
 Alabama Alabama |
2,960,167 | 73.3% | 3,125,819 | 70.3% | 3,204,402 | 67.0% | 3,171,351 | 65.3% |
 Alaska Alaska |
406,722 | 73.9% | 423,788 | 67.6% | 455,320 | 64.1% | 421,758 | 57.5% |
 Arizona Arizona |
2,626,185 | 71.7% | 3,274,258 | 63.8% | 3,695,647 | 57.8% | 3,816,547 | 53.4% |
 Arkansas Arkansas |
1,933,082 | 82.2% | 2,100,135 | 78.6% | 2,173,469 | 74.5% | 2,063,550 | 68.5% |
 California California |
17,029,126 | 57.2% | 15,816,790 | 46.7% | 14,956,253 | 40.1% | 13,714,587 | 34.7% |
 Colorado Colorado |
2,658,945 | 80.7% | 3,202,880 | 74.5% | 3,520,793 | 70.0% | 3,760,663 | 65.1% |
 Connecticut Connecticut |
2,754,184 | 83.8% | 2,638,845 | 77.5% | 2,546,262 | 71.2% | 2,279,232 | 63.2% |
 Delaware Delaware |
528,092 | 79.3% | 567,973 | 72.5% | 586,752 | 65.3% | 579,851 | 58.6% |
 District of Columbia District of Columbia |
166,131 | 27.4% | 159,178 | 27.8% | 209,464 | 34.8% | 261,771 | 38.0% |
 Florida Florida |
9,475,326 | 73.2% | 10,458,509 | 65.4% | 10,884,722 | 57.9% | 11,100,503 | 51.5% |
.svg.png.webp) Georgia Georgia |
4,543,425 | 70.1% | 5,128,661 | 62.6% | 5,413,920 | 55.9% | 5,362,156 | 50.1% |
 Hawaii Hawaii |
347,644 | 31.4% | 277,091 | 22.9% | 309,343 | 22.7% | 314,365 | 21.6% |
 Idaho Idaho |
928,661 | 92.2% | 1,139,291 | 88.0% | 1,316,243 | 84.0% | 1,450,523 | 81.7% |
 Illinois Illinois |
8,550,208 | 74.8% | 8,424,140 | 67.8% | 8,167,753 | 63.7% | 7,472,751 | 58.3% |
 Indiana Indiana |
4,965,242 | 89.6% | 5,219,373 | 85.8% | 5,286,453 | 81.5% | 5,266,034 | 75.5% |
 Iowa Iowa |
2,663,840 | 95.9% | 2,710,344 | 92.6% | 2,701,123 | 88.7% | 2,638,201 | 82.7% |
 Kansas Kansas |
2,190,524 | 88.4% | 2,233,997 | 83.1% | 2,230,539 | 78.2% | 2,122,575 | 72.2% |
 Kentucky Kentucky |
3,378,022 | 91.7% | 3,608,013 | 89.3% | 3,745,655 | 86.3% | 3,664,764 | 81.3% |
 Louisiana Louisiana |
2,776,022 | 65.8% | 2,794,391 | 62.5% | 2,734,884 | 60.3% | 2,596,702 | 55.8% |
 Maine Maine |
1,203,357 | 98.0% | 1,230,297 | 96.5% | 1,254,297 | 94.4% | 1,245,632 | 90.2% |
 Maryland Maryland |
3,326,109 | 69.6% | 3,286,547 | 62.1% | 3,157,958 | 54.7% | 3,035,979 | 47.2% |
 Massachusetts Massachusetts |
5,280,292 | 87.8% | 5,198,359 | 81.9% | 4,984,800 | 76.1% | 4,748,897 | 67.6% |
 Michigan Michigan |
7,649,951 | 82.3% | 7,806,691 | 78.6% | 7,569,939 | 76.6% | 7,295,651 | 72.4% |
 Minnesota Minnesota |
4,101,266 | 93.7% | 4,337,143 | 88.2% | 4,405,142 | 83.1% | 4,353,880 | 79.4% |
 Mississippi Mississippi |
1,624,198 | 63.1% | 1,727,908 | 60.7% | 1,722,287 | 58.0% | 1,639,077 | 55.4% |
 Missouri Missouri |
4,448,465 | 86.9% | 4,686,474 | 83.8% | 4,850,748 | 81.0% | 4,663,907 | 75.8% |
 Montana Montana |
733,878 | 91.8% | 807,823 | 89.5% | 868,628 | 87.8% | 901,318 | 83.1% |
 Nebraska Nebraska |
1,460,095 | 92.5% | 1,494,494 | 87.3% | 1,499,753 | 82.1% | 1,484,687 | 75.7% |
 Nevada Nevada |
946,357 | 78.7% | 1,303,001 | 65.2% | 1,462,081 | 54.1% | 1,425,952 | 45.9% |
 New Hampshire New Hampshire |
1,079,484 | 97.3% | 1,175,252 | 95.1% | 1,215,050 | 92.3% | 1,200,649 | 87.2% |
 New Jersey New Jersey |
5,718,966 | 74.0% | 5,557,209 | 66.0% | 5,214,878 | 59.3% | 4,863,535 | 51.8% |
 New Mexico New Mexico |
764,164 | 50.4% | 813,495 | 44.7% | 833,810 | 40.5% | 772,952 | 36.5% |
 New York New York |
12,460,189 | 69.3% | 11,760,981 | 62.0% | 11,304,247 | 58.3% | 10,598,907 | 52.5% |
 North Carolina North Carolina |
4,971,127 | 75.0% | 5,647,155 | 70.2% | 6,223,995 | 65.3% | 6,312,148 | 60.5% |
 North Dakota North Dakota |
601,592 | 94.2% | 589,149 | 91.7% | 598,007 | 88.9% | 636,160 | 81.7% |
 Ohio Ohio |
9,444,622 | 87.1% | 9,538,111 | 84.0% | 9,359,263 | 81.1% | 8,954,135 | 75.9% |
 Oklahoma Oklahoma |
2,547,588 | 81.0% | 2,556,368 | 74.1% | 2,575,381 | 68.7% | 2,407,188 | 60.8% |
 Oregon Oregon |
2,579,732 | 90.8% | 2,857,616 | 83.5% | 3,005,848 | 78.5% | 3,036,158 | 71.7% |
 Pennsylvania Pennsylvania |
10,422,058 | 87.7% | 10,322,455 | 84.1% | 10,094,652 | 79.5% | 9,725,769 | 73.5% |
 Rhode Island Rhode Island |
896,109 | 89.3% | 858,433 | 81.9% | 803,685 | 76.4% | 754,050 | 68.7% |
 South Carolina South Carolina |
2,390,056 | 68.5% | 2,652,291 | 66.1% | 2,962,740 | 64.1% | 3,178,552 | 62.1% |
 South Dakota South Dakota |
634,788 | 91.2% | 664,585 | 88.0% | 689,502 | 84.7% | 705,583 | 79.6% |
 Tennessee Tennessee |
4,027,631 | 82.6% | 4,505,930 | 79.2% | 4,800,782 | 75.6% | 4,900,246 | 70.9% |
 Texas Texas |
10,291,680 | 60.6% | 10,933,313 | 52.4% | 11,397,345 | 45.3% | 11,884,773 | 39.7% |
 Utah Utah |
1,571,254 | 91.2% | 1,904,265 | 85.3% | 2,221,719 | 80.4% | 2,465,355 | 75.4% |
 Vermont Vermont |
552,184 | 98.1% | 585,431 | 96.2% | 590,223 | 94.3% | 573,201 | 89.1% |
 Virginia Virginia |
4,701,650 | 76.0% | 4,965,637 | 70.2% | 5,186,450 | 64.8% | 5,058,363 | 58.6% |
 Washington Washington |
4,221,622 | 86.7% | 4,652,490 | 78.9% | 4,876,804 | 72.5% | 4,918,820 | 63.8% |
 West Virginia West Virginia |
1,718,896 | 95.8% | 1,709,966 | 94.6% | 1,726,256 | 93.2% | 1,598,834 | 89.1% |
 Wisconsin Wisconsin |
4,464,677 | 91.3% | 4,681,630 | 87.3% | 4,738,411 | 83.3% | 4,634,018 | 78.6% |
 Wyoming Wyoming |
412,711 | 91.0% | 438,799 | 88.9% | 483,874 | 85.9% | 469,664 | 81.4% |
| American Samoa | 682 | 1.2% | 611 | 1.1% | ||||
| Guam | 10,666 | 6.9% | 11,001 | 6.9% | ||||
| Northern Mariana Islands | 1,274 | 1.8% | 916 | 1.7% | ||||
| Puerto Rico | 33,966 | 0.9% | 26,946 | 0.7% | 24,548 | 0.8% | ||
| U.S. Virgin Islands | 8,580 | 7.9% | 3,830 | 3.6% | ||||
| United States of America |
188,128,296 | 75.6% | 194,552,774 | 69.1% | 196,817,552 | 63.7% | 191,697,647 | 57.8% |
| State | 2000 | 2010 | 2020 | |||
|---|---|---|---|---|---|---|
| Number | % 2000 | Number | % | Number | % | |
| Alabama |
3,162,808 | 71.1% | 3,275,394 | 68.5% | 3,220,452 | 64.1% |
| Alaska |
434,534 | 69.3% | 473,576 | 66.7% | 435,392 | 59.4% |
| Arizona |
3,873,611 | 75.5% | 4,667,121 | 73.0% | 4,322,337 | 60.4% |
| Arkansas |
2,138,598 | 80.0% | 2,245,229 | 77.0% | 2,114,512 | 70.2% |
| California |
20,170,059 | 79.7% | 21,453,934 | 74.0% | 16,296,122 | 41.2% |
| Colorado |
3,560,005 | 82.8% | 4,089,202 | 81.3% | 4,082,927 | 70.7% |
| Connecticut |
2,780,355 | 81.6% | 2,772,410 | 77.6% | 2,395,128 | 66.4% |
| Delaware |
584,773 | 74.6% | 618,617 | 68.9% | 597,763 | 60.4% |
| District of Columbia |
176,101 | 30.8% | 231,471 | 38.5% | 273,194 | 39.4% |
| Florida |
12,465,029 | 78.0% | 14,109,162 | 75.0% | 12,422,961 | 57.7% |
| Georgia |
5,327,281 | 65.1% | 5,787,440 | 59.7% | 5,555,483 | 51.9% |
| Hawaii |
294,102 | 24.3% | 336,599 | 24.7% | 333,261 | 22.9% |
| Idaho |
1,177,304 | 91.0% | 1,396,487 | 89.1% | 1,510,360 | 82.1% |
| Illinois |
9,125,471 | 73.5% | 9,177,877 | 71.5% | 7,868,227 | 61.4% |
| Indiana |
5,320,022 | 87.5% | 5,467,906 | 84.3% | 5,241,791 | 77.2% |
| Iowa |
2,748,640 | 93.9% | 2,781,561 | 91.3% | 2,694,521 | 84.5% |
| Kansas |
2,313,944 | 86.1% | 2,391,044 | 83.8% | 2,222,462 | 75.6% |
| Kentucky |
3,640,889 | 90.1% | 3,809,537 | 87.8% | 3,711,254 | 82.4% |
| Louisiana |
2,856,161 | 63.9% | 2,836,192 | 62.6% | 2,675,652 | 57.1% |
| Maine |
1,236,014 | 96.9% | 1,264,971 | 95.2% | 1,237,041 | 90.8% |
| Maryland |
3,391,308 | 64.0% | 3,359,284 | 58.2% | 3,007,874 | 48.7% |
| Massachusetts |
5,367,286 | 84.5% | 5,265,236 | 80.4% | 4,896,037 | 69.6% |
| Michigan |
7,966,053 | 80.2% | 7,803,120 | 78.9% | 7,444,974 | 73.9% |
| Minnesota |
4,400,282 | 89.4% | 4,524,062 | 85.3% | 4,423,146 | 77.5% |
| Mississippi |
1,746,099 | 61.4% | 1,754,684 | 59.1% | 1,658,893 | 56% |
| Missouri |
4,748,083 | 84.9% | 4,958,770 | 82.8% | 4,740,335 | 77% |
| Montana |
817,229 | 90.6% | 884,961 | 89.4% | 916,524 | 84.5% |
| Nebraska |
1,533,261 | 89.6% | 1,572,838 | 86.1% | 1,538,052 | 78.4% |
| Nevada |
1,501,886 | 75.2% | 1,786,688 | 66.2% | 1,588,463 | 51.2% |
| New Hampshire |
1,186,851 | 96.0% | 1,236,050 | 92.3% | 1,216,203 | 88.3% |
| New Jersey |
6,104,705 | 72.6% | 6,029,248 | 68.6% | 5,112,280 | 55% |
| New Mexico |
1,214,253 | 66.8% | 1,407,876 | 68.4% | 1,078,927 | 51% |
| New York |
12,893,689 | 67.9% | 12,740,974 | 65.7% | 11,143,349 | 55.2% |
| North Carolina |
5,804,656 | 72.1% | 6,528,950 | 68.5% | 6,448,459 | 62.2% |
| North Dakota |
593,181 | 92.4% | 605,449 | 90.0% | 645,938 | 82.9% |
| Ohio |
9,645,453 | 85.0% | 9,539,437 | 82.7% | 9,080,688 | 77% |
| Oklahoma |
2,628,434 | 76.2% | 2,706,845 | 72.2% | 2,514,884 | 63.5% |
| Oregon |
2,961,623 | 86.6% | 3,204,614 | 83.6% | 3,169,096 | 74.8% |
| Pennsylvania |
10,484,203 | 85.4% | 10,406,288 | 81.9% | 9,750,687 | 75% |
| Rhode Island |
891,191 | 85.0% | 856,869 | 81.4% | 782,920 | 71.3% |
| South Carolina |
2,695,560 | 67.2% | 3,060,000 | 66.2% | 3,243,442 | 63.4% |
| South Dakota |
669,404 | 88.7% | 699,392 | 85.9% | 715,336 | 80.7% |
| Tennessee |
4,563,310 | 80.2% | 4,921,948 | 77.6% | 4,990,938 | 72.2% |
| Texas |
14,799,505 | 71.0% | 17,701,552 | 70.4% | 14,609,365 | 50.1% |
| Utah |
1,992,975 | 89.2% | 2,379,560 | 86.1% | 2,573,413 | 78.7% |
| Vermont |
589,208 | 96.8% | 596,292 | 95.3% | 577,751 | 89.8% |
| Virginia |
5,120,110 | 72.3% | 5,486,852 | 68.6% | 5,208,856 | 60.3% |
| Washington |
4,821,823 | 81.8% | 5,196,362 | 77.3% | 5,130,920 | 66.6% |
| West Virginia |
1,718,777 | 95.0% | 1,739,988 | 93.9% | 1,610,749 | 89.8% |
| Wisconsin |
4,769,857 | 88.9% | 4,902,067 | 86.2% | 4,737,545 | 80.4% |
| Wyoming |
454,670 | 92.1% | 511,279 | 90.7% | 488,374 | 84.7% |
| United States of America |
211,460,626 | 75.1% | 223,553,265 | 72.4% | 204,277,273 | 61.6% |
Majority minority predictions
While under 18 non-Hispanic White Americans in the US. are already a minority as of 2020, it is projected that non-Hispanic whites overall will become a minority within the US. by 2045.[19]
Demographic consequences
Self-segregation
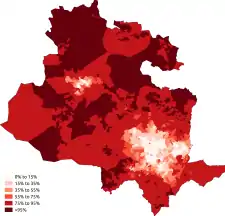
White demographic decline has also led to increased 'self-segregation' in regional area's and cities, who have all experienced a large degree of 'white flight'. When ethnic minority population's start to grow in size in a visible area there is a increased likelihood that the resident White population will move out to a more whiter area[99], research found from the think tank Demos for example in the United Kingdom has found that around 45% of ethnic minority groups live in area's in which the indigenous White British are a minority and around 41% live in areas where the White population is less than half.[87] An example of this is in London, where from the years of 2001 and 2011 over 600,000 White British Londoners left the capital and their overall percentage declined from 55% to 45% of the population[100][101] however more profound changes can be found in regional boroughs of the city itself, for example the London Borough of Barking and Dagenham saw its White British population collapse from 80.86% of the population in 2001 to a minority, 49.46% in 2011 while other ethnically diverse area's saw similar declines of percentage of the indigenous population.
Auto-segregation, or self-segregation effects many aspects of life and damages integration between different ethnic and racial groups in the countries in which it is present in. In area's which have experienced a large degree of White flight have become largely segregated along racial lines. In education, school's can become segregated as well.[102] Social cohesion in a regional area also becomes impaired as different ethnic groups 'hunker down' in the area's in which they are present in if the area becomes more heterogeneous in nature, this transformation also negatively impacts civic engagement in an area as well and results in lower social cohesion levels for ethnically diverse heterogeneous areas compared to more homogeneous area's of any specific ethnicity.[103][104]
Political impact
Anti-abortion movement
In Katha Pollitt's 2015 book Pro, the essayist links anxiety with the demographic trend of whites and correlating support for the anti-abortion movement.[16] Hampshire College professor Marlene Fried's research suggests Pollitt exposed the "underlying agenda of the antiabortion movement", recognizing that it was associated with white demographic decline and its subsequent effects on sections of the populace.[17]
Anti-immigration politics
University of Louisville's anthropology professor Steven Gardiner has proposed how:[105]
The decline in white fertility, however, is only a small part of the story. The narrative of white demographic decline is being written, primarily, in the language of immigration. It is only since Congress passed the Immigration and Naturalization Act Amendments of 1965 that American racial and ethnic demographics have taken the turn sketched above (Office of Immigration Statistics 2004, 5). Passed during the Johnson Administration, during the height of the Civil Rights era, the 1965 Act repealed the most blatantly racist aspects of the Immigration Act of 1924. It abolished the national origins quotas which had, quite intentionally, limited non-white and non-European immigration to the United States.
Based on the effect of immigration on white demography, Jaime Winders, a professor of geography at Syracuse University, notes that, for example: "In rural communities in the South, immigration often keeps smaller towns afloat, maintaining local schools, populations, and economies in the face of white demographic decline."[106] In 2020, research from University of Guadalajara's Alejandro Canales confirmed similar findings in the southern US:[107]
The current case of California, Texas, Florida, Arizona, New Mexico and Nevada are a clear indication of what we are affirming. In all of these states the traditional demographic supremacy of non-Hispanic white people practically has been diluted by the influence of Mexican and Latin-American immigration.
Conspiracy theories
Scholars have studied how the demographic decline of white people, as well as its portrayal within different types of media, have contributed towards adherence to racist and disproven conspiracy theories. Harvard University fellow José Pedro Zúquete has observed that:[14]
For many years in the American extreme right subculture a putative Jewish conspiracy – reified by the notion of ZOG or Zionist Occupation Government – was often invoked to explain the demographic decline of whites in America.
In 2019, scholar Monica Toft expanded on the emergence of nativist politics and conspiracy theory advocacy in relation to the demographic phenomenon, stating that "The 'why now' of white nativism is due to decades of demographic decline for white Americans combined with a serious decline in public education standards that leads to unwarranted nostalgia and openness to conspiracy theories."[15]
Terrorism
The Combating Terrorism Center, which is an academic institution within the United States Military Academy, has published research which recognizes anxiety regarding white demographic decline as an ongoing contributing motivation to terrorism in the Western world. An example of this was observed in the Christchurch mosque attacks in New Zealand.[108] In August 2019, a man arrested for threatening to attack people at a Jewish community center in Ohio had been found to have appeared in a documentary speaking about white demographic decline in the United States and Europe.[109]
South Africa
Scholars Hermann Giliomee and Lawrence Schlemmer have credited, among other factors, international pressure on the apartheid government and "a white demographic decline" for facilitating the process of negotiations to end apartheid in South Africa.[110]
Europe
From the start of mass non-white immigration to Europe in the late 1940s the vast majority of opinion polls taken in respective countries have shown that Europeans have been broadly against it from the very beginning.
Austria
In 2018 analysis, the Southern Poverty Law Center explored how right-wing extremism attempts to utilize the demographic decline of white people in Austria for political gain.[111]
Germany
A 1982 survey conducted by pollster Infas found that 58 percent of Germans wanted to reduce the number of foreigners in the country.[66]
Romania
Adela Fofiu of Babeș-Bolyai University has noted how right-wing organizations and outlets in Romania politicize white demographic decline, attempting to associate it with concepts such as the "Islamization of Europe" or "Gypsifcation" of the country, the latter of which refers to the Romani people in Romania.[112]
United Kingdom

The political impact of White British demographic decline in the United Kingdom has existed since non-white immigration began on a significant scale to the country in 1948.
In relation to public opinion polling, the British public have been strongly against immigration from its very inception, opinion polling as far back as 1964 has shown strong majorities against immigration and presently opposition to immigration is still in the majority, the University of Oxford's Migratory Observatory writes;
Opposition to the arrival of immigrants in the UK is not new. Rising concern about ‘New Commonwealth’ immigration prompted the British Election Study (BES) to begin asking the public about immigration as far back as 1964, although in those early years it did not ask the question to ‘coloured’ respondents. Throughout this period, the majority of people in Britain agreed that there were too many immigrants in the UK.[113][114]
In 1968, Enoch Powell gave the Rivers of Blood speech in which he criticised the then present levels of mass-immigration to the United Kingdom and called for the cessation of non-white immigration and for voluntary repatriation. While the speech was condemned by politicians on all sides of the political mainstream in Britain it attracted overwhelming public support from the general masses, Powell received around 110,000 overwhelmingly positive letters and a Gallup opinion poll commissioned by the BBC taken at the end of April 1968 showed that 74% of those asked agreed with what Powell had said in relation to voluntary repatriation of non-white immigrants in Britain, while only 15% disagreed and 11% unsure and 82% agreed with his call for the cessation of non-white immigration to the nation.[115] Conservative politician Michael Heseltine has said that if Enoch Powell had stood to be Leader of the Conservative Party in the aftermath of the speech, he would have won "by a landslide" and had he stood to be Prime Minister, he would have won by a "national landslide".[116]
Under the Labour Government of Tony Blair from 1997 to 2007, there was an apparent 'conspiracy of intent' behind the quadrupling of immigration numbers under the government at that time as was reported by the media.[117][118][119] It is claimed by a former government advisor Andrew Neather, who had been an advisor to then Home Secretary's David Blunkett and Jack Straw and Immigration Minister Barbara Roche that there was a deliberate intent "to make the UK truly multicultural" and that quote;
It didn't just happen: the deliberate policy of ministers from late-2000 until at least February last year, when the Government introduced a points-based system, was to open up the UK to mass migration. (...)
So why is it that ministers have been so very bad at communicating this? I wonder because I wrote the landmark speech given by then immigration minister Barbara Roche in September 2000, calling for a loosening of controls. It marked a major shift from the policy of previous governments: from 1971 onwards, only foreigners joining relatives already in the UK had been permitted to settle here. (...)
But the earlier drafts I saw also included a driving political purpose: that mass immigration was the way that the Government was going to make the UK truly multicultural.
I remember coming away from some discussions with the clear sense that the policy was intended – even if this wasn't its main purpose – to rub the right's nose in diversity and render their arguments out of date. That seemed to me to be a manoeuvre too far.[120]
Andrew Neather then later claimed that his words had been taken out of context;
Somehow this has become distorted by excitable right-wing newspaper columnists into being a 'plot' to make Britain multicultural. There was no plot.[121]
In 2008, the BBC commissioned a poll on the issue of immigration and race relations, on the question of 'What do you think of the statement; "There are too many immigrants in the country?"' 59% agreed, 11% neither agreed nor disagreed, 26% disagreed and 4% refused/don't know, on the question 'Should the government encourage immigrants to leave?' 49% agreed, 43% disagreed and 8% refused/don't know. The poll then asked whether the respondents considered there to be racial tension in Britain, 76% agreed, 22% disagreed and 2% did not know/refused, on the question of whether that tension would spill into violence, 64% said it was certain to fairly likely that violence would occur while 35% said it was fairly unlikely to certain to that violence would not occur, 2% did not know or refused. The poll also asked respondents whether they considered themselves to be racially prejudiced, 79% said they were not, 17% they were a little and 3% said they were very racially prejudiced, 1% of respondents did not answer or refused.[122]
In 2018, Eric Kaufmann wrote a piece for the New Statesman on the demographic decline of White British people within the United Kingdom, stating that "Three-quarters of people in Britain in 2150 will, like myself, be mixed-race." and highlighted political consequences of such a transformation taking place:[123]
When whites can't express their sense of ethnic loss, they turn to the seemingly more “respectable” alternatives of demonising Muslims, criticising immigrants who live in minority neighbourhoods, or voting for Brexit (a result of diverting concerns over ethnic change into hatred of the acceptably “white” EU). Few things have contributed more to today's populist blowback than the demographic blind spot in Western political thought.
In 2020, Nick Timothy, a former Downing Street Chief of Staff, addressed societal consequences of the ongoing demographic decline of white people in the United Kingdom:[124]
This is a difficult issue to understand and address, but the anxiety is real. White people are as attached to their ethnic and cultural identity as any other group and, faced with the reality of rapid demographic decline, many feel a sense of loss.
Canada
Writing in 2019, journalist Margaret Wente has suggested that "nations upended by right-wing populism all have one thing in common. They are all facing white demographic decline. And that is the breeding ground for populist revolts." Wente argues that with significant projected decline of the white share of the population in Canada, the country will have to address reactionary populist politics.[125]
United States
In 1998 research, Fordham University professor Tanya K. Hernandez outlined the potential for multiracial Americans to have their representative US census category "co-opted by the larger society as a mechanism for constructing a buffer class to maintain White privilege, in the midst of a growing concern with the demographic decline of White U.S. residents".[126] Samuel P. Huntington's 2004 book Who Are We? The Challenges to America's National Identity addressed the emerging population change in the United States. In an analysis on Huntington's treatise, political demographer Eric Kaufmann wrote:[127]
Finally, Huntington considers the possibility of a white nationalist response to the changes taking place. He says that white nativism is a "plausible" response to white demographic decline, the cosmopolitan defection of the white elite and the fading power of the Anglo-Protestant core.
By 2010, the Southern Poverty Law Center's 1,000 organizations listed within their "hate" and "nativist" archives predominantly involved politics referencing white demography. Arizona State University anthropologist Luis Plascencia wrote that "a common thread in many of these groups is the concern with the demographic decline of 'white' individuals".[128] In 2009, Stanford University professor Eamonn Callan observed that:[129]
The slow but inexorable demographic decline of white Americans to the status of one minority among others has begun to register in popular consciousness, making it harder for anyone to suppose that American identity could still be white identity.
In the mid-2010s, white people's demographic decline became increasing associated with politics in relation to the 2016 presidential election.[130][131] Donald Trump's policy positions and rhetoric were seen by some scholars as giving an outlet to anxiety based upon this changing white demography.[132] Journalist Christopher Caldwell argued that perceived cultural celebration of the process had contributed to the political energies supporting candidate Trump. Caldwell wrote that "At the same time, white demographic decline has been accompanied in many quarters with official exultation. The promise is not to enrich white America with new ethnicities but to replace it."[133] Research has predicted a rise in rhetoric regarding issues such as protectionism among white Americans, and particularly white evangelicals, in proportion with the ongoing percentage-share reduction of whites.[134] This demographic decline has also been utilized by extremist commentators, such as explicit supporters of the "alt-right" or white supremacist movements.[134][135]
In this regard, research in historian Mark Sedgwick's Key Thinkers of the Radical Right indicated that elements of the extremist right-wing believed that Trump's proposed policies, such as the Trump travel ban or the wall, would "slow white demographic decline".[136] Similarly, Aurora University professor Faith Agostinone-Wilson's On the Question of Truth in the Era of Trump describes these types of political aspirations as "an Americanized version of salvation, where White demographic decline is halted and the country is purged of the Other".[137] Anthropologist Rich Benjamin has suggested that the "Trump administration has aimed its rhetoric at a slice of aggrieved white Americans who are panicked about their demographic decline",[138] while political scientist Elliot Jager has written:[139]
Trump directs his appeal at disenfranchised working-class Americans by telling them that he’ll "make America great again", intimating that he’ll reverse the demographic decline of whites by "humanely" deporting 11 million mostly Hispanic, illegal aliens; will protect the homeland by banning Muslims from entering, and will build an impenetrable barrier on the Mexican border.
In the 2020s, study of American politics increasingly factored in the demographic reduction in analyzing the Republican Party's electoral success and future strategy. For example, in analysis of the 2020 presidential election results, University of Melbourne professor Timothy J. Lynch suggests "white demographic decline need not spell disaster for the GOP. Despite his dog-whistle racism, Trump performed better than expected among Black voters."[140] In relation to the party's future direction, UCLA's political scientist Gary Segura notes that "Republicans nationally receive 85 percent of their votes from white voters by capturing between 55 and 60 percent of their ballots in each election", adding that "with the demographic decline of white voters, even 60 percent of that cohort will be a poor start when it comprises just two-thirds of the electorate in 2024".[141] Professor Nicholas Lemann also argues that high motivation and corresponding turnout from the Republican Party's supporter base would be required to offset the ongoing demographic decline of whites by the 2024 election.[142]
Interviewed by Jeffrey Goldberg in 2020, the director of the documentary film White Noise proposed that the decline of whites had become the most significant driving force in the politics of the US. Daniel Lombroso stated "There is a deep-seated fear of white demographic decline in this country, and obviously in Europe. And I think that is now the defining fault line in American politics".[143]
A study by Pew Research Center in co-ordinance with the release of the U.S. Census 2020 results found that the majority of American's overall (61%) found that the White population of the U.S. declining is 'neither a good or bad thing'. White people in the United States however were still recorded more to have negative views (11%/22% reported that white decline was a good/bad thing) on the subject then positive views compared to other racial groups (Blacks; 22%/21%, Hispanic; 20%/16%, Asian; 25%/16%). Moreover, the younger the participants were the more positive view they had on white decline and those that are socially conservative also had more negative views of the subject then those that were socially liberal.[144]
References
- Bureau, US Census. "1950 Census of Population: Volume 2. Characteristics of the Population". The United States Census Bureau. Retrieved 2021-07-31.
- "A Milestone En Route to a Majority Minority Nation". Pew Research Center’s Social & Demographic Trends Project. 2012-11-07. Retrieved 2021-07-31.
- Frey, William H. (2018-03-14). "The US will become 'minority white' in 2045, Census projects". Brookings. Retrieved 2021-07-31.
- "Census shows white decline, nonwhite majority among youngest". ABC News. Retrieved 2021-07-31.
- "Reflecting a demographic shift, 109 U.S. counties have become majority nonwhite since 2000". Pew Research Center. Retrieved 2021-07-31.
- "United Nations: World Population Prospects (Figure 7. Average annual net migration by region, 1980–2015)" (PDF). United Nations. 2017.
- "10 demographic trends shaping the U.S. and the world in 2017". Pew Research Center. Retrieved 2021-08-01.
- "Fertility Rates In The United States By Ethnicity". WorldAtlas. 13 February 2020. Retrieved 2021-07-31.
- Mizrahi, Isaac. "The Minority-Majority Shift. Two Decades That Will Change America. The Surge Of Multiracial Families". Forbes. Retrieved 2021-07-31.
- "Demographic Trends in California: 1970–2040" (PDF).
- "U.S. Census Bureau QuickFacts: California; United States". www.census.gov. Retrieved 2021-07-31.
- Iwan Morgan (23 December 2010). "Why the US outstrips Europe for population growth". BBC.
- Hope Yen (March 17, 2013). "Rise of Latino population blurs US racial lines". Associated Press.
Despite being a nation of immigrants, America's tip to a white minority has never occurred in its 237-year history and will be a first among the world's major post-industrial societies. Brazil, a developing nation, has crossed the threshold to “majority-minority” status; a few cities in France and England are near, if not past that point.
- José Pedro Zúquete (2018). The Identitarians: The Movement against Globalism and Islam in Europe. University of Notre Dame Press. ISBN 978-0268104214.
- Monica Toft (January 11, 2019). "White right? How demographics is changing US politics". Salon.
- Katha Pollitt (2015). Pro: Reclaiming Abortion Rights. Picador. ISBN 978-1250072665.
Anti-feminism, shaming of sexually active girls and single women, fears of white demographic decline and conservative views of marriage and sexuality, or outright misogyny.
- Marlene Fried (2015). "Review: A Positive Social Good". Women's Review of Books. 32. Old City Publishing. pp. 3–5.
- Temkin, Moshik (March 13, 2017). "A Historical Context for Immigration Policy and Sentiment Today". Harvard Kennedy School.
- Population and Development Review, Wiley Online Library, March 12, 2020,
A fortiori in the existing circumstances of white demographic decline. (On white decline in the United States, see the article by Kenneth M. Johnson in this issue.) ... The US Census Bureau's assessment of when America will become 'majority minority' is an evident case in point. For the country as a whole, the currently projected year is 2045; for the under-18 population, 2020. But aside from the absurd degree of precision, the calculation ignores the blurring of ethnic boundaries that inevitably takes place—in particular, 'whiteshift'.
- Hui Bai; Christopher M. Federico (2020), White and Minority Demographic Shifts, Intergroup Threat, and Right-Wing Extremism, University of Minnesota: PsyArXiv
- Isaac Chotiner (April 30, 2019). "A Political Scientist Defends White Identity Politics". The New Yorker.
- "Taking White Interests Seriously?". Hannah Arendt Center for Politics and Humanities. May 26, 2019.
- Richard Alba (January 6, 2017). "The U.S. is becoming more racially diverse. But Democrats may not benefit". The Washington Post.
To begin with, the census data that these forecasts are based on exaggerate the extent of white demographic decline; even the prediction of a majority-minority society is not guaranteed. The reason lies in the census misclassifications of a fast-growing group of young Americans from ethno-racially mixed backgrounds.
- Frey, William H. (July 1, 2020). "The nation is diversifying even faster than predicted, according to new census data". Brookings Institution.
- "Non-whites will be majority in US and Europe by 2050". The Guardian. 2000-09-03. Retrieved 2021-09-08.
- David Coleman (2006), "Immigration and Ethnic Change in Low-Fertility Countries: A Third Demographic Transition", Population and Development Review, 32, Population Council, pp. 401–446
- Roberts, Sam (2009-12-17). "Projections Put Whites in Minority in U.S. by 2050". The New York Times. ISSN 0362-4331. Retrieved 2021-12-12.
- "G7 nations stand out for their low birth rates, aging populations". Pew Research Center. Retrieved 2021-07-31.
- Giuseppe Carone; Declan Costello (September 2006). "Can Europe Afford to Grow Old? – Finance & Development, September 2006". International Monetary Fund. Retrieved May 15, 2021.
- Jonathan Vespa (March 13, 2018). "The Graying of America: More Older Adults Than Kids by 2035". census.gov. Retrieved May 15, 2021.
- "Median age over 43 years in the EU – Products Eurostat News – Eurostat". Eurostat. November 2019. Retrieved May 15, 2021.
- "United Nations Population Division | Department of Economic and Social Affairs". www.un.org. Retrieved 2021-09-11.
- "NEW REPORT ON REPLACEMENT MIGRATION ISSUED BY UN POPULATION DIVISION | Meetings Coverage and Press Releases". www.un.org. Retrieved 2021-09-11.
- "EU should 'undermine national homogeneity' says UN migration chief". BBC News. 2012-06-21. Retrieved 2021-09-11.
- Ritchie, Hannah; Roser, Max (2019-09-20). "Age Structure". Our World in Data.
- "2019 National Vital Statistics Reports | NCHS" (PDF).
- "Overview of Multiple Pregnancy – Health Encyclopedia – University of Rochester Medical Center". www.urmc.rochester.edu. Retrieved 2021-07-31.
- Fang, Jing; Madhavan, Shantha; Alderman, Michael H. (1999-01-01). "Low Birth Weight: Race and Maternal Nativity— Impact of Community Income". Pediatrics. 103 (1): e5. doi:10.1542/peds.103.1.e5. ISSN 0031-4005. PMID 9917485.
- "Race, Evolution, and Behavior". www.harbornet.com. Retrieved 2021-07-31.
- Dudley L. Poston Jr.; Rogelio Sáenz (May 25, 2019). "Demographic trends spell the end of the white majority in 2044". Associated Press.
Census Bureau projections show that the U.S. population will be “majority-minority” sometime between 2040 and 2050. Our research suggests that this will happen around 2044. Indeed, in 2020, there are projected to be more nonwhite children than white children in the U.S.
- Eric Kaufmann; Matthew Goodwin (25 October 2018). "Rising ethnic diversity in the West may fuel a (temporary) populist right backlash". London School of Economics.
- "Trump understands what many miss: people don't make decisions based on facts". Vox Media. February 8, 2017.
In the 'racial shift' condition, white study participants read about how by 2050, minorities will represent the majority of people in the United States. In the control condition, participants read about a neutral subject. Those who read about demographic change expressed less warm feelings toward minorities.
- More Diverse Yet Less Tolerant? How the Increasingly Diverse Racial Landscape Affects White Americans Racial Attitudes (Personality and Social Psychology Bulletin ed.), SAGE Publications, 2014,
Perceived threat to Whites' societal status mediated the effects of the racial shift information on explicit racial attitudes. These results suggest that rather than ushering in a more tolerant future, the increasing diversity of the nation may instead yield intergroup hostility. Implications for intergroup relations and media framing of the racial shift are discussed.
- "Notion of Minority-Majority Nation Exacerbates White Racism". Pacific Standard. March 18, 2014.
- "Why the Announcement of a Looming White Minority Makes Demographers Nervous". The New York Times. November 22, 2018.
Their findings, first published in 2014, showed that white Americans who were randomly assigned to read about the racial shift were more likely to report negative feelings toward racial minorities than those who were not. They were also more likely to support restrictive immigration policies and to say that whites would likely lose status and face discrimination in the future.
- Hynek Pallas (June 30, 2019). "Don't take away racism". Göteborgs-Posten.
- Fraser Myers (February 25, 2020). "The dangerous war on 'whiteness'". Spiked.
Bestselling books talk of White Fragility and Dying of Whiteness. Political upheavals are said to be driven by Whiteshift.
- "Event details". York Festival of Ideas. 6 June 2019.
Author and political scientist Eric Kaufmann explains why one of the most crucial challenges of our time is to enable conservatives as well as cosmopolitans to view whiteshift as a positive development.
- Michael Barone (May 20, 2019). "Michael Barone: Will 'whiteshift' save America from ethnic strife?". Omaha World-Herald.
Will Kaufmann's optimistic "whiteshift" scenario ever happen? The current political brouhaha is discouraging, but our history provides grounds for cautious optimism.
- Michael Burleigh. "Majority Report" (Issue 470 ed.). Literary Review.
- Dowell Myers (May 19, 2018). "The demise of the white majority is a myth". The Washington Post.
These stories of white decline obscure the ongoing changes to America's color line, and they serve only to divide. Fortunately, the white American public seems far more content with the more inclusive future that is actually destined to emerge.
- Statistics on Australia's international migration, internal migration (interstate and intrastate), and the population by country of birth, June 30, 2020
- de Carbonnel, Alissa (March 21, 2017). "Belgium struggles to open police to Muslim minority". Reuters.
Belgium does not keep statistics on religion or race, but an estimated seven percent of the population is Muslim
- "Origin | Statbel". statbel.fgov.be. Retrieved 2021-12-12.
- Newmedia, R. T. L. (2021-01-13). "Un résident belge sur huit est de nationalité étrangère: grosse différence entre Bruxelles et le reste du pays". RTL Info (in French). Retrieved 2021-12-12.
- Government of Canada, Statistics Canada (2017-10-25). "Visible Minority and Population Group Reference Guide, Census of Population, 2016". www12.statcan.gc.ca. Retrieved 2021-12-13.
- Government of Canada, Statistics Canada (2017-01-25). "The Daily — Study: A look at immigration, ethnocultural diversity and languages in Canada up to 2036, 2011 to 2036". www150.statcan.gc.ca. Retrieved 2021-09-08.
- Dunham, Jackie (2017-01-25). "Nearly half of Canadians will be immigrants, children of immigrants by 2036: StatsCan". CTVNews. Retrieved 2021-09-08.
- "The politics of 2036, when Canada is as brown as it is white". Retrieved 2021-09-08.
- "Total Population by Visible Minority Population (1), for Canada, 1996" (PDF). web.archive.org. 2021-02-27. Retrieved 2021-12-12.
- "Aboriginal population 1996" (PDF). web.archive.org. 2015-09-24. Retrieved 2021-12-12.
- "2001 Community Profiles". web.archive.org. 2008-10-06. Retrieved 2021-12-12.
- "2006 Community Profiles – Province/Territory". web.archive.org. 2009-04-20. Retrieved 2021-12-12.
- Government of Canada, Statistics Canada (2013-05-08). "2011 National Household Survey Profile – Province/Territory". www12.statcan.gc.ca. Retrieved 2021-09-08.
- Government of Canada, Statistics Canada (2017-02-08). "Census Profile, 2016 Census – Canada [Country] and Canada [Country]". www12.statcan.gc.ca. Retrieved 2021-09-08.
- SPIEGEL, Claus Hecking, DER (August 2013). "Secret Minutes: Chancellor Kohl Wanted Half of Turks Out of Germany". Der Spiegel. Retrieved 2021-08-20.
- "Premiere in Frankfurt: Mehr als die Hälfte mit ausländischen Wurzeln". FAZ.NET (in German). ISSN 0174-4909. Retrieved 2021-08-20.
- "Chapter 6: Ethnicity and Irish Travellers" (PDF). 2017.
- "Ethnicity – CSO – Central Statistics Office". www.cso.ie. Retrieved 2021-08-25.
- "Irish could be minority ethnic group here by 2050 – professor". The Irish Times. Mar 19, 2005.
- "CBS StatLine – Bevolking; generatie, geslacht, leeftijd en herkomstgroepering, 1 januari", Statline.cbs.nl
- Terpstra, Jendra (2017-03-28). "Wit is de 'nieuwe minderheid' in grote steden". Trouw (in Dutch). Retrieved 2021-08-20.
- Major ethnic groups in New Zealand, January 28, 2015
- "Number of persons with foreign or Swedish background (detailed division) by region, age and sex. Year 2002 – 2020". Statistikdatabasen. Retrieved 2021-08-20.
- "BBC Politics 97". www.bbc.co.uk. Retrieved 2021-08-18.
- "Lords Hansard text for 04 July 2013". publications.parliament.uk. Retrieved 2021-09-07.
- webarchive.nationalarchives.gov.uk https://webarchive.nationalarchives.gov.uk/ukgwa/20160105181734/http://www.ons.gov.uk/ons/rel/migration1/migration-statistics-quarterly-report/august-2014/stb-msqr-august-2014.html. Retrieved 2021-12-13. Missing or empty
|title=(help) - "50 years of collecting ethnicity data – History of government". history.blog.gov.uk. Retrieved 2021-12-13.
- As UK Census data past 2001 is unavailable through the ONS website, it has been recommended to use archival census collection websites to obtain data. Data is taken from United Kingdom Casweb Data services of the United Kingdom 1991 Census on Ethnic Data for England, Scotland and Wales and the population total of Northern Ireland
- "Office of National Statistics; 2001 Census Key Statistics". webarchive.nationalarchives.gov.uk. Retrieved 2021-09-07.
- "Analysis of Ethnicity in the 2001 Census – Summary Report". www.gov.scot. Retrieved 2021-09-07.
- "Northern Ireland Neighbourhood Information Service". 2001.
- "Office of National Statistics; 2011 Census Key Statistics". webarchive.nationalarchives.gov.uk. Retrieved 2021-09-07.
- "Births by parents' country of birth, England and Wales – Office for National Statistics". www.ons.gov.uk. Retrieved 2021-09-07.
- Ford, Richard. "White Britons are London minority after years of immigration growth". ISSN 0140-0460. Retrieved 2021-12-12.
- "From infusion to diffusion | The Economist". The Economist. 2021-08-22. Archived from the original on 2021-08-22. Retrieved 2021-09-07.
- "White Britons 'In Retreat' From Minority Areas". Sky News. 6 May 2013.
- Coleman, David (November 17, 2010). "When Britain becomes 'majority minority'". Prospect.
Outside London, Leicester and the City of Birmingham are both expected to become 'majority minority' some time in the 2020s.
- David Coleman (2010), "Projections of the Ethnic Minority Populations of the United Kingdom 2006–2056", Population and Development Review, 36, Wiley Online Library, pp. 441–486
- Klein, Ezra (2018-07-30). "White threat in a browning America". Vox. Retrieved 2021-12-12.
- "The Browning of America | The Nation". web.archive.org. 2020-10-28. Retrieved 2021-12-12.
- "Census shows US is diversifying, white population shrinking". AP NEWS. 2021-08-12. Retrieved 2021-08-16.
- Bureau, US Census. "About the Topic of Race". Census.gov. Retrieved 2021-12-14.
- "About the Topic of Race". Census.gov. US Census Bureau. Retrieved 15 December 2021.
 This article incorporates text from this source, which is in the public domain.
 - Bureau, US Census. "Race and Ethnicity in the United States: 2010 Census and 2020 Census". Census.gov. Retrieved 2021-12-13.
- Levine, Sam (August 12, 2021). US’s white population declines for first time ever, 2020 census finds. The Guardian.
- Bureau, US Census. "Race and Ethnicity in the United States: 2010 Census and 2020 Census". Census.gov. Retrieved 2021-12-14.
- Rahman, Samia, 'Segregation in Bradford', the Guardian, 21 Dec 2009.
- See also: 'One city, two cultures: Bradford's communities lead parallel lives', the Guardian, 19 Jun 2015
- 'Bradford highlighted in national study about segregation', Telegraph & Argus, 2 Nov 2016
- ''Unacceptable segregation' in Bradford', the Independent, 10 July 2001
- Mohdin, Aamna. "White people abandon diverse neighborhoods for racial, not economic reasons". Quartz. Retrieved 2021-12-14.
- "Let's talk about the exodus of 600,000 whites from London". www.telegraph.co.uk. Retrieved 2021-12-14.
- "Why have the white British left London?". BBC News. 2013-02-20. Retrieved 2021-12-14.
- "Schools in the East End dividing by race – News – London Evening Stan…". archive.ph. 2013-05-05. Retrieved 2021-12-14.
- "Love Thy Neighbor? Not in L.A." Los Angeles Times. 2001-03-01. Retrieved 2021-12-14.
- "The Paradox of Diverse Communities". www.bloomberg.com. Retrieved 2021-12-14.
- Steven L. Gardiner (2004). "The More Things Change: Immigration, Demographics and the Rise of White Identity Politics in America" (PDF). University of Memphis. pp. 6–7.
- Jamie Winders (2011). "Representing the Immigrant". In Robert Brinkmann; Graham A. Tobin (eds.). Southeastern Geographer: Innovations in Southern Studies. The University of North Carolina Press. ISBN 978-0807882870.
In rural communities in the South, immigration often keeps smaller towns afloat, maintaining local schools, populations, and economies in the face of white demographic decline.
- Alejandro I. Canales (2020). "Introduction". Migration, Reproduction and Society: Economic and Demographic Dilemmas in Global Capitalism (Studies in Critical Social Sciences). Haymarket Books. p. 12. ISBN 978-1642593549.
- Graham Macklin (July 2019). "The Christchurch Attacks: Livestream Terror in the Viral Video Age". In Paul Cruickshank (ed.). CTC Sentinel. 12. Combating Terrorism Center. p. 21.
Whether Tarrant was conscious of it or not, the title of his manifesto, 'The Great Replacement', which encapsulated his fears about white demographic decline, derived from French anti-immigration writer Renaud Camus, to whom the phrase is commonly attribut-ed, though the basic idea has a far longer historical lineage.
- Dakin Andone; Amir Vera; Eliott C. McLaughlin (August 19, 2019). "Man accused of threatening an Ohio Jewish center declared himself a white nationalist in a documentary, police say". CNN.
In the documentary, Reardon tells an interviewer that he doesn't consider himself a neo-Nazi, but he is a white nationalist and a member of the alt-right. 'I want a homeland for white people, and I think every race should have a homeland', Reardon said. He went on to say there's a 'demographic decline' going on not only in the US, but in Europe as well.
- Giliomee, Hermann; Schlemmer, Lawrence (1990). From Apartheid to Nation Building. Oxford University Press. ISBN 978-0195705508.
Forces propelling the change process ... a white demographic decline, growing black militancy, foreign pressure, changes in the Afrikaner class composition, and the fiscal crisis of the South African state.
- Barthélemy, Hélène (February 14, 2018). "How to write history like an Identitarian". Southern Poverty Law Center.
They also attempt to unify a youth crippled by boredom in an unfulfilling consumerist society by enlisting them in a civilizational quest: the defense of Europe, described as under siege by immigration, 'Islamization' and white demographic decline.
- Adela Fofiu (2014). "Stories of a White Apocalypse on the Romanian Internet". In Veronica Watson; Deirdre Howard-Wagner; Lisa Spanierman (eds.). Unveiling Whiteness in the Twenty-First Century: Global Manifestations, Transdisciplinary Interventions. Lexington Books. ISBN 978-0739192962.
Of particular and recurring discussion on the blog were the demographic decline of white people, the purported ... Islamization of Europe, and Gypsification ... Much of the content supported the position that a conspiracy existed to bring about the downfall of the white race ... A Romanian women gives birth on average to 1.3 children, a Romani women – 3 children. What will Romania look like in 2050?
- "UK Public Opinion toward Immigration: Overall Attitudes and Level of Concern". Migration Observatory. Retrieved 2021-09-08.
- "Public attitudes towards immigration". Full Fact. 2014-12-10. Retrieved 2021-09-08.
- "British Conservative sees Foreign Influx as Threat". Eugene Register-Guard. December 1968.
- "BBC – White Season – Rivers of Blood". web.archive.org. 2008-03-15. Retrieved 2021-12-12.
- "Labour wanted mass immigration to make UK more multicultural, says former adviser". www.telegraph.co.uk. Retrieved 2021-08-20.
- "Hideously Diverse Britain: The immigration 'conspiracy'". The Guardian. 2011-03-02. Retrieved 2021-08-20.
- "Labour 'Encouraged Mass Immigration To UK'". 2012-10-07. Archived from the original on 2012-10-07. Retrieved 2021-08-25.
- "Don't listen to the whingers – London needs immigrants". www.standard.co.uk. 2012-04-12. Retrieved 2021-08-20.
- "Former Labour adviser denies immigration plot to undermine right". The Guardian. 2009-10-26. Retrieved 2021-08-20.
- "Britons fear race violence – poll". 2008-04-17. Retrieved 2021-08-20.
- Kaufmann, Eric (2018). "White majorities feel threatened in an age of mass migration – and calling them racist won't help". New Statesman.
- Timothy, Nick (2014). Remaking One Nation: The Future of Conservatism. Polity. ISBN 978-1509539178.
- "Can Canada avoid a populist revolt?". The Globe and Mail. February 8, 2019.
The nations upended by right-wing populism all have one thing in common. They are all facing white demographic decline. And that is the breeding ground for populist revolts. These revolts are linked directly to immigration, as Eric Kaufmann argues in his deeply researched new book, Whiteshift: Populism, Immigration and the Future of White Majorities. In Canada, the demographic shift will be huge. Today about 20 per cent of Canadians are visible minorities. But in 90 years, only about 20 per cent of Canadians will be white
- Tanya K. Hernandez (1998). "Multiracial Discourse: Racial Classifications in an Era of Color-blind Jurisprudence blind Jurisprudence". Fordham University.
- Eric Kaufmann (July 24, 2004). "Ethnic America". Prospect.
- Plascencia, Luis F.B. (2013). "Attrition Through Enforcement and the Elimination of a "Dangerous Class"". In Lisa Magaña; Erik Lee (eds.). Latino Politics and Arizona's Immigration Law SB 1070 (Immigrants and Minorities, Politics and Policy). Springer Publishing. p. 119. ISBN 978-1461402954.
- Eamonn Callan (2009). "Democratic Patriotism and Multicultural Education". In Michael S. Katz; Susan Verducci; Gert Biesta (eds.). Education, Democracy and the Moral Life. Springer Publishing. p. 64. ISBN 978-9048120765.
- Sam Roudman (November 1, 2016). "Pat Buchanan is 'Delighted to Be Proven Right' by 2016 Election". New York.
There's a lot that's been made in this election about Trump's coalition, about the demographic decline of White America.
- Rebecca Barrett-Fox (November 2018). "A King Cyrus President: How Donald Trump's Presidency Reasserts Conservative Christians' Right to Hegemony". Humanity & Society. 42. SAGE Publications. pp. 502–522.
That this movement has gained power even amid continuing demographic decline of white American Christians and waning U.S. global hegemony is only further evidence for them of God's hand in the 2016 election and thus God's approval of such trades.
- Edna Chun; Alvin Evans (2018). "An Improbable Landscape for Diversity Cultural Change". Leading a Diversity Culture Shift in Higher Education: Comprehensive Organizational Learning Strategies (New Critical Viewpoints on Society). Routledge. ISBN 978-1138280717.
With the demographic decline of whites in America, Donald Trump has given voice to the anger of white citizens who do not feel privileged.
- Christopher Caldwell (17 September 2016). "Trump's forgotten people". The Spectator.
- Damon T. Berry (2017). Blood and Faith: Christianity in American White Nationalism (Religion and Politics). Syracuse University Press. ISBN 978-0815635321.
These findings also perhaps point to the susceptibility of white Americans, white Evangelicals in particular, to Far Right ideology expressed by the Alt-Right and white nationalists ... As demographics continue to trend toward the decline of the white majority in the United States, a demographic decline of white Evangelicals in particular, we may see the increasing appeal of protectionist rhetoric as a radicalizing element for some white Americans, Christian and non-Christian alike.
- Peter Savodnik (February 11, 2020). "'How Could You Not Connect the Dots?': Inside the Red-Pilling of State Department Official Matthew Gebert". The Spectator.
Then, on the morning of August 7, 2019, Hatewatch reported that Gebert was the leader of an alt-right cell in Northern Virginia, and that he had posted anti-Semitic comments on white nationalist forums and been a guest on a now defunct podcast called The Fatherland, which addressed issues like white demographic decline
- Sedgwick, Mark (2019). Key Thinkers of the Radical Right: Behind the New Threat to Liberal Democracy. Oxford University Press. ISBN 978-0190877590.
Trump's economic protectionist, anti-immigration platform, from building the wall to the 'Muslim ban', represent measures that, Johnson believes, will slow white demographic decline, 'giving us a few extra decades before we are a minority in our homeland'. Trump is not the 'last chance' for whites 'but he is the last chance for the United States of America', he argues.
- Godwin, Jeremy T. (2020). "The Gospel According to White Christian Nationalism". In Agostinone-Wilson, Faith (ed.). On the Question of Truth in the Era of Trump (Critical Media Literacies). Brill Publishers. ISBN 978-9004391277.
An Americanized version of salvation, where White demographic decline is halted and the country is purged of the Other. Whether the person who buys the hat actually 'believes' these things is mostly irrelevant, because the act of consumption, followed by the act of wearing, is a ritual that signals 'you are in it'.
- Rich Benjamin (July 19, 2019). "Trump's race-baiting hasn't produced many policy wins, but that was never the point". Los Angeles Times.
- Jager, Elliot (April 9, 2016). "Should Jews worry about Trump?". The Jerusalem Post.
- Timothy J. Lynch (November 9, 2020). "What's next for the Republicans after Trump?". University of Melbourne.
- Segura, Gary (2012). "The Browning of America". Democracy.
- Lemann, Nicholas (October 23, 2020). "The Republican Identity Crisis After Trump". The New Yorker.
It would require extremely high motivation among Trump's base-- mainly exurban or rural, actively religious, and not highly educated-- along with a strong appeal to affluent whites ... in the Trump heartland, he could compensate, at least in part, for the demographic decline of white voters.
- Goldberg, Jeffrey (October 21, 2020). "The Challenge of Documenting White Nationalism". The Atlantic.
- Krogstad, Jens Manuel; Dunn, Amina; Passel, Jeffrey S. "Most Americans say the declining share of White people in the U.S. is neither good nor bad for society". Pew Research Center. Retrieved 2021-12-14.