Blue Ridge School District
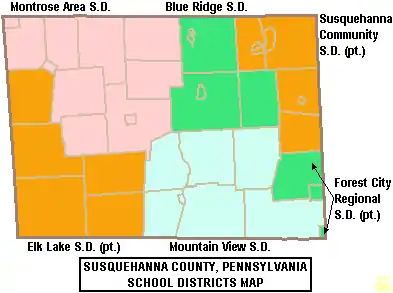
The Blue Ridge School District is a small, rural, public school district located in Susquehanna County in northeastern Pennsylvania. It serves the Boroughs of Great Bend, Hallstead and New Milford and Great Bend Township, Jackson Township and New Milford Township. The educational attainment levels for the Blue Ridge School District population (25 years old and over) were 89.6% high school graduates and 13.5% college graduates.[16] The district is one of the 500 public school districts of Pennsylvania.
| Blue Ridge School District | |
|---|---|
 | |
| Address | |
5058 School Road New Milford , , 18834 United States | |
| Information | |
| Type | Public |
| School board | 9 locally elected members |
| Superintendent | Mr. Matthew Button,(2015–2019)[1] |
| Dean | Unfilled |
| Administrator | Brian Dolan, Business Manager |
| Principal | Casey Webster, MS & HS |
| Principal | Mrs Danelle Decker, BRES |
| Staff | 78 non-teaching staff (2014) |
| Faculty | 80 teachers (2013)[2] |
| Grades | PreK-12 |
| Age | 4 years old to 21 years old special ed |
| Number of pupils | 1,060 pupils (2015)[3] 1,025 pupils (2013)[4] |
| • Kindergarten | 89 (2014),[7] 122 (2010) |
| • Grade 1 | 69 (2014), 78 |
| • Grade 2 | 78 (2014), 65 |
| • Grade 3 | 80 (2014), 70 |
| • Grade 4 | 66 (2014), 79 |
| • Grade 5 | 65 (2014), 81 |
| • Grade 6 | 93 (2014), 83 |
| • Grade 7 | 64 (2014), 79 |
| • Grade 8 | 72 (2014), 79 |
| • Grade 9 | 68 (2014), 89 |
| • Grade 10 | 85 (2014), 76 |
| • Grade 11 | 77 (2014), 95 |
| • Grade 12 | 84 (2014), 103 |
| • Other | 76 (2014) |
| Language | English |
| Color(s) | Red and white |
| Mascot | Raiders |
| Newspaper | The Raider Reader |
| Budget | $17,192,560 (2015-16)[8][9] $16,714,606 (2014-15)[10] |
| Tuition | ES - $8,577.88, HS - $9,552.73[12] |
| Per-pupil spending | $15,813.12 (2013)[13] $14,962.85 (2010)[14][15] |
| Website | www |
According to the Pennsylvania Budget and Policy Center, 42.9% of the district's pupils lived at 185% or below the Federal Poverty Level as shown by their eligibility for the federal free or reduced price school meal programs in 2012.[17] In 2013, the Pennsylvania Department of Education reported that 13 students in the Blue Ridge School District were homeless.[18]
Blue Ridge School District operates three schools: Blue Ridge High School, Blue Ridge Middle School and Blue Ridge Elementary School. High school students may choose to attend the Susquehanna County Career Technology Center for training in the construction and mechanical trades.
Academic achievement
In 2015, Blue Ridge School District ranked 326th out of 493 Pennsylvania public school districts, by the Pittsburgh Business Times.[19] The ranking is based on the last 3 years of student academic achievement as demonstrated by PSSAs results in: reading, writing, math and science and the three Keystone Exams (literature, Algebra 1, Biology I) in high school.[20] Three school districts were excluded because they do not operate high schools (Saint Clair Area School District, Midland Borough School District, Duquesne City School District). The PSSAs are given to all children in grades 3rd through 8th. Adapted PSSA examinations are given to children in the special education programs. Writing exams were given to children in 5th and 8th grades.[21]
|
In 2009, the academic achievement, of the students in the Blue Ridge School District, was in the 27th percentile among all 500 Pennsylvania school districts Scale (0-99; 100 is state best)[28]
District AYP status history
In 2012, Blue Ridge School District achieved Adequate Yearly Progress (AYP) status.[29] Blue Ridge School District achieved AYP status each year from 2004 to 2010, while in 2003 the district was in Warning status due to lagging student academic achievement.[30]
Graduation rate
In 2015, Blue Ridge School District's graduation rate was 90.67%.[31]
- 2014 - 85.5%[32]
- 2013 - 88.4%[33]
- 2012 - 81%[34]
- 2011 - 75%.[35]
- 2010 - 73%, the Pennsylvania Department of Education issued a new, 4-year cohort graduation rate.[36]
According to traditional graduation rate calculations:
High school
Blue Ridge High School is located at 5058 School Road, New Milford. In 2015, enrollment was reported as 315 pupils in 9th through 12th grades, with 45.4% of pupils eligible for a free lunch due to the family meeting the federal poverty level. Additionally, 11.75% of pupils received special education services, while 11.75% of pupils were identified as gifted.[40] The school employed 29 teachers.[41] Per the Pennsylvania Department of Education, 100% of the teachers were rated "Highly Qualified" under the federal No Child Left Behind Act.[42]
According to the National Center for Education Statistics, in 2010, the school reported an enrollment of 377 pupils in grades 9th through 12th, with 166 pupils eligible for a federal free or reduced-price lunch due to family poverty. The Blue Ridge High School employed 30 teachers, yielding a student–teacher ratio of 12:1.[43] According to a report by the Pennsylvania Department of Education, 5 teachers have emergency certification.[44]
- 2015 School Performance Profile
Blue Ridge High School achieved a 75.8 score out of 100. Reflects on grade level reading, mathematics and science achievement. The PDE reported that 76% of the High School's students were on grade level in reading/literature. In Algebra 1, only 66% of students showed on grade level skills at the end of the course. In Biology I, just 47% demonstrated on grade level science understanding at the end of the course.[45] Statewide, 53 percent of schools with an eleventh grade achieved an academic score of 70 or better. Five percent of the 2,033 schools with 11th grade were scored at 90 and above; 20 percent were scored between 80 and 89; 28 percent between 70 and 79; 25 percent between 60 and 69 and 22 percent below 60. The Keystone Exam results showed: 73 percent of students statewide scored at grade-level in English, 64 percent in Algebra I and 59 percent in biology.[46][47]
- 2014 School Performance Profile
Blue Ridge High School achieved a 74.3 score out of 100. Reflects on grade level reading, mathematics and science achievement. In reading/literature, 77% were on grade level. In Algebra 1, 69.7% showed on grade level skills. In Biology, 54% demonstrated on grade level science understanding at the end of the course.[48][49] Statewide, the percentage of high school students who scored proficient and advanced in Algebra I increased to 39.7% to 40.1%. The percentage of high school students who scored proficient and advanced in reading/literature declined to 52.5%. The percentage of high school students who scored proficient and advanced in biology improved from 39.7% to 41.4%.[50]
According to the Pennsylvania Department of Education, 2,134 of 2,947 Pennsylvania public schools (72 percent of Pennsylvania public schools), achieved an academic score of 70 or higher.[51] Fifty-three percent of schools statewide received lower SPP scores compared with last year's, while 46 percent improved. A handful were unchanged.[52][53]
- 2013 School Performance Profile
Blue Ridge High School achieved a score of 77.5 out of 100. Reflects on grade level reading, mathematics and science achievement. In reading/literature, 77% were on grade level. In Algebra 1, 70% showed on grade level skills. In Biology, 40.5% showed on grade level science understanding.[54] According to the Pennsylvania Department of Education, 2,181 public schools (less than 73 percent of Pennsylvania public schools), achieved an academic score of 70 or higher. Pennsylvania 11th grade students no longer take the PSSAs. Instead, beginning in 2012, they take the Keystone Exams at the end of the associated course.[55]
AYP history
- PSSA Results
Pennsylvania System of School Assessments, commonly called PSSAs are No Child Left Behind Act related examinations which were administered from 2003 through 2012, in all Pennsylvania public high schools. The exams were administered in the Spring of each school year. The goal was for 100% of students to be on grade level or better in reading and mathematics, by the Spring of 2014. The tests focused on the state's Academic Standards for reading, writing, mathematics and science. The Science exam included content in science, technology, ecology and the environmental studies. The mathematics exam included: algebra I, algebra II, geometry and trigonometry. The standards were first published in 1998 and are mandated by the Pennsylvania State Board of Education.[56] In 2013, the Commonwealth of Pennsylvania changed its high school assessments to the Keystone Exams in Algebra 1, Reading/literature and Biology1. The exams are given at the end of the applicable course, rather than all in the spring of the student's 11th grade year.[57]
- 11th Grade Reading
- 2012 - 68% on grade level, (11% below basic). State - 67% of 11th graders are on grade level.[58]
- 2011 - 64% (15% below basic). State - 69.1%[59]
- 2010 - 69% (14% below basic). State - 66%[60]
- 2009 - 61% (21% below basic). State - 65% [61]
- 2008 - 73% (16% below basic). State - 65%[62]
- 2007 - 59% (16% below basic), State - 65%[63]
- 11th Grade Math
- 2012 - 67% on grade level (16% below basic). In Pennsylvania, 59% of 11th graders are on grade level.[64]
- 2011 - 60% (19% below basic). State - 60.3%
- 2010 - 64% (18% below basic). State - 59%
- 2009 - 49% (30% below basic). State - 56%
- 2008 - 64% (23% below basic). State - 56%[65]
- 2007 - 54% (21% below basic). State - 53%
- 11th Grade Science
- 2012 - 46% on grade level (7% below basic). State - 42% of 11th graders were on grade level.[66]
- 2011 - 18% (11% below basic). State - 40%
- 2010 - 50% (8% below basic), State - 39%
- 2009 - 37% (17% below basic). State - 40%
- 2008 - 37% (16% below basic). State - 39%
College remediation
According to a Pennsylvania Department of Education study released in January 2009, 17% of Blue Ridge High School graduates required remediation in mathematics and or reading before they were prepared to take college level courses in the Pennsylvania State System of Higher Education or community colleges.[67] Less than 66% of Pennsylvania high school graduates, who enroll in a four-year college in Pennsylvania, will earn a bachelor's degree within six years. Among Pennsylvania high school graduates pursuing an associate degree, only one in three graduate in three years.[68] Per the Pennsylvania Department of Education, one in three recent high school graduates who attend Pennsylvania's public universities and community colleges takes at least one remedial course in math, reading or English.
Graduation requirements
Among Pennsylvania's 500 public school districts, graduation requirements widely vary. Blue Ridge School Board has determined that a pupil must earn 24 credits to graduate, including: a required class every year in math, English, social studies, science, Physical Education and 8 credits of electives.[69]
For nearly two decades, all Pennsylvania secondary school students were required to complete a project as a part of their eligibility to graduate from high school. The type of project, its rigor and its expectations are set by the individual school district.[70] Effective with the graduating class of 2017, the Pennsylvania State Board of Education eliminated the state mandate that students complete a culminating project to graduate.[71] Blue Ridge continues to require the project which focuses on career planning and job shadowing.
By Pennsylvania State School Board regulations, beginning with the class of 2019,[72] public school students must demonstrate successful completion of secondary level course work in Algebra I, Biology, and English Literature by passing the respective Keystone Exams for each course.[73][74] The exam is given at the end of the course. Keystone Exams replace the PSSAs for 11th grade.[75]
Students have several opportunities to pass the exam. Schools are mandated to provide targeted assistance to help the student be successful. Those who do not pass after several attempts can perform a project to graduate.[76][77] For the class of 2019, a Composition exam will be added. For the class of 2020, passing a civics and government exam will be added to the graduation requirements.[78] In 2011, Pennsylvania high school students field tested the Algebra 1, Biology and English Lit exams. The statewide results were: Algebra 1 38% on grade level, Biology 35% on grade level and English Lit - 49% on grade level.[79] Individual student, school or district reports were not made public, although they were reported to district officials by the Pennsylvania Department of Education. Students identified as having special needs and qualifying for an Individual Educational Program (IEP) may graduate by meeting the requirements of their IEP.
SAT scores
In 2014, 41 Blue RIdge School District students took the SAT exams. The district's Verbal Average Score was 476. The Math average score was 478. The Writing average score was 441.[80][81] Statewide in Pennsylvania, Verbal Average Score was 497. The Math average score was 504. The Writing average score was 480. The College Board also reported that nationwide scores were: 497 in reading, 513 in math and 487 in writing.[82] In 2014, 1,672,395 students took the SATs in the United States.
In 2013, 48 Blue Ridge School District students took the SAT exams. The district's Verbal Average Score was 482. The Math average score was 493. The Writing average score was 458. The College Board reported that statewide scores were: 494 in reading, 504 in math and 482 in writing. The nationwide SAT results were the same as in 2012.[83]
In 2012, 46 Blue Ridge School District students took the SAT exams. The district's Verbal Average Score was 467. The Math average score was 456. The Writing average score was 442. The statewide Verbal SAT exams results were: Verbal 491, Math 501, Writing 480. In the US, 1.65 million students took the exams achieving scores: Verbal 496, Math 514, Writing 488. According to the College Board the maximum score on each section was 800, and 360 students nationwide scored a perfect 2,400.
In 2011, 60 Blue Ridge School District students took the SAT exams. The district's Verbal Average Score was 491. The Math average score was 488. The Writing average score was 468.[84] Pennsylvania ranked 40th among states with SAT scores: Verbal - 493, Math - 501, Writing - 479.[85] In the United States 1.65 million students took the exam in 2011. They averaged 497 (out of 800) verbal, 514 math and 489 in writing.[86]
Middle school
Blue Ridge Middle School is located at 5058 School Road, New Milford. In 2015, enrollment was 225 pupils, in grades 6th through 8th, with 52.9% of pupils eligible for a free lunch due to family poverty. Additionally, 15.5% of pupils received special education services, while less than 1% of pupils were identified as gifted.[87] According to a 2014 report by the Pennsylvania Department of Education, 100% of its teachers were rated "Highly Qualified" under No Child Left Behind.[88]
In 2010, Blue Ridge Middle School reported an enrollment of 257 pupils in grades 6th through 8th, with 135 pupils eligible for a federal free or reduced-price lunch due to family poverty. The school employed 23 teachers, yielding a student–teacher ratio of 11:1.[89] According to a report by the Pennsylvania Department of Education, 100% of the teachers were rated "Highly Qualified" under No Child Left Behind.[90] In 2010, the attendance rate was reported as 95%. In 2011 the attendance rate declined to 94%. In 2011,
- 2015 School Performance Profile
The PDE withheld SPP scores. It was reported that 55% of 8th grade students at Blue Ridge Middle School students were on grade level in reading on the PSSAs given in April 2015. In math/Algebra 1, 14% of 8th grade students showed on grade level skills. In science, 64% of the school's 8th graders demonstrated on grade level science understanding. No eighth grade writing scores were reported. In 7th grade, 58% were on grade level in reading, while just 20% showed on grade level math skills. Among 6th graders, 64% were on grade level in reading and 28% were on grade level in mathematics.[91] Statewide 58% of eighth (8th) graders were on grade level in reading, while 29% demonstrated on grade level math skills. Pennsylvania 7th graders were 58% on grade level in reading and 33% demonstrated on grade level math skills. Among sixth (6th) graders, 60.7% were reading on grade level, while 39.7% demonstrated on grade level math skills. Statewide 61.9% of fifth (5th) graders were on grade level in reading, while 42.8% demonstrated on grade level math skills.[92]
- 2014 School Performance Profile
Blue Ridge Middle School achieved a score of 68.9 out of 100. Reflects on grade level reading, mathematics and science achievement. In reading/literature, 68.37% were on grade level. In Algebra 1/Math, 69% showed on grade level mathematics skills. In Science, 56.7% of 8th graders showed on grade level science understanding. In writing, 79% of the 8th grade students demonstrated on grade level writing skills.[93]
- 2013 School Performance Profile
Blue Ridge Middle School achieved out of 100. Reflects on grade level reading, writing, mathematics and science achievement. In reading, 74% of the students were on grade level. In Mathematics/Algebra 1, 77% of the students showed on grade level skills. In Science, only 55% of the 8th graders demonstrated on grade level understanding. In writing, 80% of the 8th grade students demonstrated on grade level writing skills.[94] According to the Pennsylvania Department of Education, 2,181 public schools (less than 73 percent of Pennsylvania public schools), achieved an academic score of 70 or higher.
AYP history
Blue Ridge Middle School declined to Warning AYP status due to the lagging academic achievement of its sixth grade pupils in 2011 and 2012.[95] In 2010, Blue Ridge Middle School achieved AYP status.[96] In 2008, Blue Ridge Middle School declined to Warning AYP status, due to lagging student achievement.
- PSSA Results:
Sixth and seventh grades have been tested in reading and mathematics since 2006. Eighth graders are tested in: reading, writing, mathematics and Science. Beginning in the Spring of 2013, eighth graders, who are enrolled in Algebra I take the Keystone Exam for Algebra I at the end of the course. The testing of 8th grade in reading and mathematics began in 1999, as a state initiative.[97] Testing in science began in 2007. The goal is for 100% of students to be on grade level or better in reading and mathematics, by the Spring of 2014. The tests focus on the state's Academic Standards for reading, writing, mathematics and science.[98] The standards were published in 1998 and are mandated by the Pennsylvania State Board of Education.[99] In 2014, the Commonwealth of Pennsylvania adopted the Pennsylvania Core Standards - Mathematics.[100]
- 8th Grade Reading
- 2012 - 64% on grade level (10% below basic). In Pennsylvania, 79% of 8th graders on grade level.[101]
- 2011 - 82%, 55% advanced (1% below basic). State - 81.8%[102]
- 2010 - 81%, 47% advanced (11% below basic). State - 81%[103]
- 2009 - 72%, 47% advanced (19% below basic), State - 80%
- 2008 - 78%, 31% advanced (9% below basic), State - 78%
- 2007 - 78%, 52% advanced (10% below basic), State - 75%[104]
- 8th Grade Math
- 2012 - 77% on grade level (4% below basic). State - 76% [105]
- 2011 - 84%, 58% advanced (2% below basic). State - 76.9%
- 2010 - 91%, 65% advanced (1% below basic) State - 75%
- 2009 - 75%, 45% advanced (10% below basic), State - 71%
- 2008 - 71%, 40% advanced (16% below basic), State - 70%[106]
- 2007 - 66%, 42% advanced (11% below basic), State - 67%
- 8th Grade Science
- 2012 - 61% on grade level (15% below basic). State - 59%[107]
- 2011 - 62% (18% below basic). State – 58.3%
- 2010 - 58% (15% below basic). State - 57%.
- 2009 - 57%, State - 54%[108]
- 2008 - 46%, State - 52%[109]
|
|
|
|
- Dropout Early Warning System
In 2013, Blue Ridge School District implemented a no-cost dropout prevention Early Warning System and Interventions Catalog at the junior high school.[110] The process identifies students at risk for dropping out by examining the pupil's: attendance, behavior and course grades. Interventions are implemented to assist at-risk pupils to remain in school. The program is funded by federal and private dollars.[111]
Blue Ridge Elementary School
Blue Ridge Elementary School is located at 5058 School Road, New Milford. In 2015, the school's enrollment was 517 pupils in grades preschool through 5th, with 50.6% of pupils receiving a federal free or reduced-price meals due to family poverty. Additionally, 6% of the pupils receive special education services, while less than 1% are identified as gifted.[112] According to a report by the Pennsylvania Department of Education, 100% of the teachers were rated highly qualified under No Child Left Behind. The school provides full-day kindergarten.[113] The school is a federally designated Title I school.
In 2010, Blue Ridge Elementary School reported an enrollment of 511 pupils in grades kindergarten through 5th, with 305 pupils eligible for a federal free or reduced-price lunch due to family poverty. The school employed 40 teachers, yielding a student–teacher ratio of 12:1.[114] According to a report by the Pennsylvania Department of Education, 100% of the teachers were rated "Highly Qualified" under No Child Left Behind.[115]
Blue Ridge School District has provided full-day kindergarten for more than a decade.[116] and preschool.[117] Proponents of full-day kindergarten claim it will reduce special education numbers and it will raise primary student academic achievement in reading.[118] Reading achievement has not improved. it has actually declined substantially.[119][120]
- 2015 School Performance Profile
According to the Pennsylvania Department of Education, 63% of 5th grade students at Blue Ridge Elementary School were on grade level in reading on the PSSAs given in April 2015. In mathematics, 23% of 5th grade students showed on grade level skills. No fifth grade writing scores were reported. In 4th grade, 38% were on grade level in reading, while 23% showed on grade level math skills. In science, 87% of fourth graders showed on grade level understanding. Among third (3rd) graders, 60% were on grade level in reading and 30% were on grade level in mathematics.[121] Statewide 61.9% of fifth (5th) graders were on grade level in reading, while 42.8% demonstrated on grade level math skills. Pennsylvania 4th graders were 58.6% on grade level in reading and 44.4% demonstrated on grade level math skills. In science, 77.3% of fourth graders showed on grade level understanding. Among Pennsylvania third (3rd) graders, 62% were reading on grade level, while 48.5% demonstrated on grade level math skills.[122]
- 2014 School Performance Profile
Blue Ridge Elementary School achieved a score of 83.3 out of 100. The score reflects on grade level: reading, science, writing and mathematics achievement. In 2013-14, only 69% of the students were reading on grade level in grades 3rd through 5th. In 3rd grade, 69.7% of the pupils were reading on grade level. In math, 69% were on grade level (3rd-5th grades). In 4th grade science, 83% of the pupils demonstrated on grade level understanding. In writing, 87.95% of 5th grade pupils demonstrated on grade level skills.[123]
- 2013 School Performance Profile
Blue Ridge Elementary School achieved a score of 84.5 out of 100. The score reflects on grade level: reading, science, writing and mathematics achievement. In 2012-13, only 73% of the students were reading on grade level in grades 3rd through 5th. In 3rd grade, 73% of the pupils were reading on grade level. In math, 74% were on grade level (3rd-5th grades). In 4th grade science, just 94.87% of the pupils demonstrated on grade level understanding. In writing, only 78.33% of 5th grade pupils demonstrated on grade level skills.[124] According to the Pennsylvania Department of Education, 2,181 public schools (less than 73 percent of Pennsylvania public schools), achieved an academic score of 70 or higher.
AYP history
In 2010 through 2012, Blue Ridge Elementary School achieved AYP status each school year. In 2010 the attendance rate was reported as 95%.[125] All students can receive a free breakfast regardless of their ability to pay.[126] Low income students are eligible for a free school lunch as determined by the Federal National School Lunch Program.[127]
- PSSA History
Each year, in the Spring, in order to comply with the federal No Child Left Behind Law, the 3rd graders take the PSSAs in math and reading. The fourth grade is tested in reading, math and science. The fifth grade is evaluated in reading, mathematics and writing. Pennsylvania System of School Assessments, commonly called PSSAs are No Child Left Behind Act related examinations which were administered beginning 2003 to all Pennsylvania public school students in grades 3rd-8th.[128] The goal was for 100% of students to be on grade level or better in reading and mathematics, by the Spring of 2014.[129][130][131] The tests focused on the state's Academic Standards for reading, writing, mathematics and science. The Science exam is given to 4th grades and includes content in science, technology, ecology and the environmental studies.[132] The first cohort of Blue Ridge children who attended Accountability Block Grant funded full-day kindergarten reached third grade and took the PSSAs in the spring of 2009.
|
|
|
|
- 4th Grade Science
- 2012 - 98%, (0% below basic). State - 82%
- 2011 - 94%, 45% advanced, (0% below basic), State – 82.9%
- 2010 - 94%, 55% advanced. State - 81%
- 2009 - 88%, 42% advanced. State - 83%
- 2008 - 80%, 24% advanced. State - 81%
|
|
Special education
In December 2013, Blue Ridge School District administration reported that 140 pupils, or 13.6% of the district's pupils, received special education services, with 35% of the identified students having a specific learning disability.[140] Special education services in the Commonwealth are provided to students from ages three years to 21 years old. In the 2010-2011 school year, the total student enrollment was more than 1.78 million students with approximately 275,000 students eligible for special education services. Among these students 18,959 were identified with mental retardation and 21,245 students with autism.[141] The largest group of students are identified as Specific Learning Disabilities 126,026 students (46.9 percent) and Speech or Language Impairments with 43,542 students (16.2 percent).
In December 2010, the district administration reported that 249 pupils, or 21% of the district's pupils, received Special education services. Fifty one percent of the special education students were identified as having a Specific Learning Disability. In December 2009, 269 children or 23% of the district's pupils received Special education services.[142]
The district engages in identification procedures to ensure that eligible students receive an appropriate educational program consisting of special education and related services, individualized to meet student needs. At no cost to the parents, these services are provided in compliance with state and federal law; and are reasonably calculated to yield meaningful educational benefit and student progress. To identify students who may be eligible for special education, various screening activities are conducted on an ongoing basis. These screening activities include: review of group-based data (cumulative records, enrollment records, health records, report cards, ability and achievement test scores); hearing, vision, motor, and speech/language screening; and review by the Instructional Support Team or Student Assistance Team. When screening results suggest that the student may be eligible, the district seeks parental consent to conduct a multidisciplinary evaluation. Parents who suspect their child is eligible may verbally request a multidisciplinary evaluation from a professional employee of the district or contact the Special Education Department.[143]
Students who have an Individual Education Plan (IEP) may take the PSSA-M an alternative math exam rather than the PSSA.[144] Some special education students may take the PASA (Pennsylvania Alternate System of Assessment), rather than the PSSA.[145] Schools are permitted to provide accommodations to some students.[146]
In 2010, the state of Pennsylvania provided $1,026,815,000 for special education services. This funding is in addition to the state's basic education per pupil funding, as well as, all other state and federal funding.[147] The Pennsylvania Special Education funding system assumes that 16% of the district's students receive special education services. It also assumes that each student's needs accrue the same level of costs.[148] The state requires each district to have a three-year special education plan to meet the unique needs of its special education students.[149] Overidentification of students, to increase state funding, has been an issue in the Commonwealth. Some districts have more than 20% of its students receiving special education services while others have 10% supported through special education.[150] The state requires each public school district and charter school to have a three-year special education plan to meet the unique needs of its special education students.[151] In 2012, the Obama Administration's US Department of Education issued a directive requiring schools include students with disabilities in extracurricular activities, including sports.[152]
Blue Ridge School District received a $704,832 supplement for special education services in 2010.[153] For the 2011-12 school year, all Pennsylvania public school districts received the same level of funding for special education that they received in 2010-11. This level funding is provided regardless of changes in the number of pupils who need special education services and regardless of the level of services the respective students required.[154] For the 2014-2015 school year, BRSD received an increase to $714,292 from the Commonwealth for special education funding.[155] Additionally, the state provides supplemental funding for extraordinarily impacted students. The district must apply for this added funding.
In 2013, the state's Special Education Funding Reform Commission provided a report on the state of funding for special education in the Commonwealth.[156] Funding for special education programs is borne largely on a local basis at 60%, with the state contributing $1 billion or 30% and the federal government providing 10% of the funding.
Gifted education
The District Administration reported that 19 or 1.66% of its students were gifted in 2009.[157] By law, the district must provide mentally gifted programs at all grade levels. The primary emphasis is on enrichment and acceleration of the regular education curriculum through a push in model with the gifted instructor in the classroom with the regular instructor. This approach permits such specialized instructional strategies as tiered assignments, curriculum compacting, flexible grouping, learning stations, independent projects and independent contracts. Students identified as gifted attending the High School have access to honors and advanced placement courses, and dual enrollment with local colleges. The referral process for a gifted evaluation can be initiated by teachers or parents by contacting the student's building principal and requesting an evaluation. All requests must be made in writing. To be eligible for mentally gifted programs in Pennsylvania, a student must have a cognitive ability of at least 130 as measured on a standardized ability test by a certified school psychologist. Other factors that indicate giftedness will also be considered for eligibility.[158]
Enrollment and consolidation
Blue Ridge School District is experiencing low enrollment in K-12. The Pennsylvania Department of Education projects the district's enrollment will remain below 1000 pupils through 2018.[159] Shifting population trends across the U.S. and Pennsylvania are affecting school enrollment and may impact the building needs of school districts in the years to come.[160] Over the last 10 years, rural Pennsylvania school enrollment decreased by over 8 percent.[161] According to a 2009 public school district administration consolidation proposal by Governor Edward Rendell, the excessive administrative overhead dollars could be redirected to improve lagging academic achievement, to enrich the academic programs or to reduce property taxes.[162] Consolidation of two central administrations into one would not require the closing of any schools. The Governor's proposal called for the savings to be redirected to improving lagging reading and science achievement, to enriching the academic programs or to reducing residents' property taxes.[163]
A study done by Standard and Poor's in 2007 (at the request of the Pennsylvania General Assembly), examined the Blue Ridge School District consolidating administrations with neighboring Mountain View School District. It found that residents in both districts would realize substantial savings in a consolidation. Savings of over $1000 per pupil were estimated.[164] Superintendent were asked about savings, if their district were to merge with another district at the administrative level only, but not close any of their schools. It found 42% of survey respondents thought consolidation could achieve cost reductions. Additionally, 63% of responding superintendents believed that consolidation with another district would help provide additional academic enrichment opportunities for the students.[165]
In March 2011, the Pennsylvania Institute of Certified Public Accountants Fiscal Responsibility Task Force released a report which found that consolidating school district administrations with one neighboring district would save the Commonwealth $1.2 billion without forcing the consolidation of any schools.[166]
References
- Kathleen Bolus (August 23, 2015). "New Blue Ridge Superintendent plans to increase student achievement". The Times-Tribune.
- National Center of Education statistics (2016). "Blue Ridge School District Common Core of Data".
- Pennsylvania Department of Education (2015). "Blue Ridge School District District Fast Facts 2015".
- Pennsylvania Department of Education, Enrollment by LEA and school, 2013-14
- Pennsylvania Department of Education, Enrollment by LEA and school, 2012-13
- Pennsylvania Department of Education, Enrollment and Projections by District 2007-2020, July 2010
- PDE, Enrollment by LEA, 2014-15
- STACI WILSON (June 11, 2015). "Blue Ridge approves $17M budget". Independent Weekender Editor. Archived from the original on April 12, 2016. Retrieved April 3, 2016.
- "Blue Ridge School Board Meeting Minutes June 2015" (PDF). June 8, 2015.
- "Blue Ridge School Board Meeting Minutes June 2014" (PDF). June 30, 2014.
- "Blue Ridge School Board Meeting Minutes June 2013" (PDF). June 24, 2013.
- Pennsylvania Department of Education, Tuition rates per LEA, 2010
- PDE, Finances Selected Data 2013-14, 2014
- PDE, Finances Selected Data 2010-11, 2011
- PDE, Finances Selected Data 2008-09, 2009
- proximityone (2014). "School District Comparative Analysis Profiles".
- Pennsylvania Budget and Policy Center, Education Facts Student Poverty Concentration by LEA, 2012
- Collin Deppen (January 2015). "How many children are homeless in your school district?" (PDF). Pennsylvania Department of Education.
- Pittsburgh Business Times (April 10, 2015). "Guide to Pennsylvania Schools Statewide School District Ranking 2015".
- Pittsburgh Business Times (April 11, 2014). "What makes up a district's School Performance Profile score?".
- Paul Jablow (November 18, 2015). "Understanding the PSSA exams". The Notebook.
- Pittsburgh Business Times (April 11, 2014). "Western Pennsylvania School Guide 2014".
- "Statewide Honor Roll Rankings 2013". Pittsburgh Business Times. April 5, 2013.
- Pittsburgh Business Times, Guide to Western Pennsylvania Schools Statewide Rankings, April 6, 2012
- Pittsburgh Business Times, Statewide Honor Roll Rankings 2011, April 2, 2011
- Pittsburgh Business Times (May 1, 2010). "Statewide Honor Roll".
- "Three of top school districts in state hail from Allegheny County". Pittsburgh Business Times. May 23, 2007. Archived from the original on July 18, 2011.
- "2009 PSSA RESULTS Blue Ridge School District". The Morning Call. Archived from the original on 2012-05-07. Retrieved March 2011. Check date values in:
|access-date=(help) - Pennsylvania Department of Education (September 21, 2012). "Blue Ridge School District AYP Overview 2012". Archived from the original on March 24, 2016.
- Pennsylvania Department of Education, Pennsylvania District AYP History 2003-2010, 2011
- PDE, Graduation rate by LEA, 2015
- PDE, Graduation rate by LEA, 2014
- PDE, Graduation rate by LEA, 2013
- Pennsylvania Department of Education (September 21, 2012). "Blue ridge School District AYP Data Table 2012". Archived from the original on September 22, 2012.
- Pennsylvania Department of Education, Blue Ridge School District AYP DataTable 2011, September 29, 2011
- Pennsylvania Department of Education (March 15, 2011). "New 4-year Cohort Graduation Rate Calculation Now Being Implemented". Archived from the original on September 14, 2010.
- "Blue Ridge School District Academic Achievement Report Card 2010 data table". Archived from the original on September 22, 2012. Retrieved March 29, 2011.
- The Times-Tribune (June 25, 2009). "Susquehanna County Graduation Rates 2008".
- Pennsylvania Partnerships for Children. "High School Graduation rate 2007". Archived from the original on November 5, 2012. Retrieved January 31, 2011.
- Pennsylvania Department of Education (November 4, 2015). "Blue Ridge High School Fast Facts 2015".
- U.S. News & World Report, Best High Schools, 2015
- Pennsylvania Department of Education (2015). "Highly Qualified Teacher Guidelines". Archived from the original on 2016-06-24.
- National Center for Education Statistics, Common Care Data - Blue Ridge High School, 2010
- Pennsylvania Department of Education, Professional Qualifications of Teachers Blue Ridge High School, September 29, 2011
- Pennsylvania Department of Education (November 4, 2015). "Blue Ridge High School School Performance Profile 2015".
- Jan Murphy (November 4, 2015). "Report card for state's high schools show overall decline". Pennlive.com.
- Pennsylvania Department of Education (November 4, 2015). "2015 Keystone Exam School Level Data".
- Pennsylvania Department of Education (November 6, 2014). "Blue Ridge High School Academic Performance Data 2014".
- Evamarie Socha (November 6, 2014). "Half of Valley districts see state test scores decline". The Daily Item.
- Eleanor Chute (November 21, 2014). "Pennsylvania student scores declined with reduced funding, test results show". Pittsburgh Post-Gazette.
- Acting Secretary of Education Carolyn Dumaresq, Acting Secretary of Education Announces Results of 2013-14 School Performance Profile; Strong Performance in 72 Percent of Schools, November 6, 2014
- Kathy Boccella; Dylan Purcell & Kristen A. Graham (November 6, 2014). "Pa. school rankings: Downingtown STEM No. 1; Phila. falters". The Philadelphia Inquirer.
- Jan Murphy (November 6, 2014). "More Pa. school scores decline than improve, state report card shows". Pennlive.com.
- Pennsylvania Department of Education, Blue Ridge High School Academic Performance Data 2013, October 4, 2013
- Eleanor Chute & Mary Niederberger (December 11, 2013). "New assessment shows fuller picture of Pa. schools". Pittsburgh Post-Gazette.
- Pennsylvania Department of Education (2014). "State Academic Standards".
- Pennsylvania Department of Education (2014). "State Assessment System".
- Pennsylvania Department of Education (September 29, 2012). "2011-2012 PSSA and AYP Results".
- Pennsylvania Department of Education (September 29, 2011). "Blue Ridge High School Academic Achievement Report card 2011" (PDF).
- "2010 PSSAs: Reading, Math, Writing and Science Results".
- Pennsylvania Department of Education (September 14, 2010). "2009 PSSAs: Reading, Math, Writing and Science Results".
- "The 2008 PSSA Mathematics and Reading School Level Proficiency Results (by Grade and School Total)". August 2008.
- Pennsylvania Department of Education. "PSSA Math and Reading results by School and Grade 2007".
- "How is your school doing?". Pittsburgh Post-Gazette. October 15, 2012.
- "Math PSSA Scores by District 2007-08 Blue Ridge School District Results". The Times-Tribune. June 25, 2009.
- Pennsylvania Department of Education (September 21, 2012). "Blue Ridge High School Academic Achievement Report Card 2012" (PDF). Archived from the original (PDF) on April 15, 2016.
- Pennsylvania Department of Education (January 2009). "Pennsylvania College Remediation Report".
- National Center for Education Statistics
- Blue Ridge School Board (2015). "Graduation Requirements Blue Ridge High School" (PDF).
- Pennsylvania State Board of Education. "Pennsylvania Code §4.24 (a) High school graduation requirements".
- Pennsylvania State Board of Education, Proposed changes to Chapter 4, May 10, 2012
- Jan Murphey (February 3, 2016). "Wolf signs bill to suspend use of Keystone Exams as a graduation requirement". Pennlive.com. Archived from the original on February 6, 2016.
- Pennsylvania Department of Education (2010). "Keystone Exam Overview" (PDF).
- "State moves ahead with plan to delay Keystone Exams as graduation requirement". Associated Press. January 20, 2016.
- Megan Harris (September 12, 2013). "Pennsylvania changing high school graduation requirements". Tribune Live.
- Pennsylvania Department of Education (September 2011). "Pennsylvania Keystone Exams Overview". Archived from the original on 2012-03-17.
- Pennsylvania State Board of Education (2010). "Rules and Regulation Title 22 PA School Code CH. 4".
- Pennsylvania Department of Education, State Board of Education Finalizes Adoption of Pennsylvania Common Core State Academic Standards and High School Graduation Requirements, March 14, 2013
- Pennsylvania Department of Education (2011). "Keystone Exams".
- PDE, School Performance profile, November 6, 2014
- Pennsylvania Department of Education (2014). "SAT and ACT Scores".
- College Board (2014). "2014 College-Bound Seniors State Profile Report" (PDF).
- College Board (2013). "The 2013 SAT Report on College & Career Readiness".
- Pennsylvania Department of Education (2011). "Public School SAT Scores 2011". Archived from the original on 2011-10-15.
- College Board, SAT Scores State By State - Pennsylvania, September 2011
- Star-Ledger Staff NJ.com, While U.S. SAT scores dip across the board, N.J. test-takers hold steady, September 2011
- Pennsylvania Department of Education (November 4, 2015). "Blue Ridge Middle School Fast Facts 2015".
- Pennsylvania Department of Education, Professional Qualifications of Teachers Blue Ridge Middle School, November 5, 2015
- National Center for Education Statistics, Common Care Data - Blue Ridge Middle School, 2010
- Pennsylvania Department of Education, Professional Qualifications of Teachers Blue Ridge Middle School, September 29, 2011
- Pennsylvania Department of Education (October 1, 2015). "2015 PSSA School Level Data".
- Pennsylvania Department of Education (October 1, 2015). "2015 PSSA State Level Data".
- Pennsylvania Department of Education (November 6, 2014). "Blue Ridge Middle School Academic Performance Data 2014".
- PDE, Blue Ridge Middle School Academic Performance Data 2013, October 4, 2013
- Pennsylvania Department of Education (September 29, 2011). "Blue Ridge Middle School AYP Overview". Archived from the original on March 4, 2016.
- Pennsylvania Department of Education (September 29, 2011). "Blue Ridge Middle School AYP Overview". Archived from the original on March 4, 2016.
- Pennsylvania Department of Education. "IU16-PSSA 95-96 Results by School". Retrieved May 11, 2014.
- Pennsylvania Department of Education (2014). "Standards Aligned Systems".
- Pennsylvania Department of Education (2014). "State Academic Standards".
- Pennsylvania Department of Education (2014). "State Academic Standards Mathematics".
- "How is your school doing?". Pittsburgh Post-Gazette. October 15, 2012.
- Pennsylvania Department of Education (September 29, 2011). "Blue Ridge Middle School Academic Achievement Report Card 2011" (PDF).
- Pennsylvania Department of Education, Blue Ridge Middle School Academic Achievement Report Card 2010, September 14, 2010
- Pennsylvania Department of Education. "PSSA Math and Reading Results 2007". Archived from the original on 2017-05-25. Retrieved February 2011. Check date values in:
|access-date=(help) - Pennsylvania Department of Education (September 21, 2012). "Blue Ridge School Academic Achievement Report Card 2012" (PDF). Archived from the original (PDF) on April 16, 2016.
- Pennsylvania Department of Education. "PSSA Results Math and Reading School 2008". Retrieved February 2011. Check date values in:
|access-date=(help) - The Times-Tribune (2012). "Grading Our Schools database, 2011-12 Science PSSA results". Archived from the original on 2017-06-06.
- Pennsylvania Department of Education. "PSSA Science results 2008-09". Retrieved February 2011. Check date values in:
|access-date=(help) - Pennsylvania Department of Education. "Science Results by School and Grade 2008". Retrieved February 2011. Check date values in:
|access-date=(help) - Office of First Lady (September 2, 2014). "Pennsylvania First Lady and Acting Secretary of Education Announce 35 Schools Statewide Implementing Dropout Program".
- Pennsylvania Department of Education, The Early Warning System, 2014
- Pennsylvania Department of Education (November 4, 2015). "Blue Ridge Elementary School Fast Facts 2015".
- Pennsylvania Department of Education, School Performance Profile, Blue Ridge Elementary School Fast Facts 2015, December 2015
- National Center for Education Statistics, Common Care Data - Blue Ridge Elementary School, 2010
- Pennsylvania Department of Education, Professional Qualifications of Teachers Blue Ridge Elementary School, September 29, 2011
- PDE, Full Day Kindergarten report 2010-11, 2010
- PDE, Governor Rendell Announces Grants for 'Pre-K Counts' Early Childhood Initiative, 2007
- Malia Villegas, Early Education Policy Brief, WestEd Center on Policy, April 2005
- Pennsylvania Department of Education, M School District Academic Report Card 2012, 2012
- Pennsylvania Department of Education (October 1, 2015). "2015 PSSA School Level Data".
- Pennsylvania Department of Education (October 1, 2015). "2015 PSSA School Level Data".
- Pennsylvania Department of Education (October 1, 2015). "2015 PSSA State Level Data".
- Pennsylvania Department of Education (November 6, 2014). "Blue Ridge Elementary School Academic Performance Data 2014".
- PDE, Blue Ridge Elementary School Academic Performance Data 2013, October 4, 2013
- Pennsylvania Department of Education. "Blue Ridge Elementary School AYP Data Table". Archived from the original on September 22, 2012. Retrieved March 31, 2011.
- Blue Ridge School District Administration. "Blue Ridge Elementary School Handbook".
- Pennsylvania Department of Education. "National School Lunch Program".
- Pennsylvania State Board of Education (2003). "PSSA results 2003".
- New America Foundation (2003). "No Child Left Behind Overview".
- The Goals of No Child Left Behind (July 20, 2010). "The Goals of No Child Left Behind". Archived from the original on 2014-05-19. Retrieved 2016-04-04.
- Learning Point Associates (2002). "Understanding the No Child Left Behind Act" (PDF).
- Pennsylvania State Board of Education (January 11, 2003). "Pennsylvania Academic Standards Science and Technology, Ecology and Environment". Archived from the original on November 27, 2015.
- Pennsylvania Department of Education (September 21, 2012). "Blue Ridge Elementary School Academic Achievement Report Card 2010" (PDF).
- Pennsylvania Department of Education (September 29, 2011). "Blue Ridge Elementary School Academic Achievement Report Card 2011" (PDF).
- Pennsylvania Department of Education, Blue Ridge Elementary School Academic Achievement Report Card 2010, October 20, 2010
- Pennsylvania Department of Education, Blue Ridge Elementary School Academic Achievement Report Card 2009, September 14, 2009
- Pennsylvania Department of Education, Blue Ridge Elementary School Academic Achievement Report Card 2008, August 15, 2008
- Pennsylvania Department of Education, Blue Ridge Elementary School Academic Achievement Report Card 2007, 2007
- "How is your school doing?". Pittsburgh Post-Gazette. October 15, 2012.
- Pennsylvania Bureau of Special Education Services (2013). "Blue Ridge Area School District Special Education Data Report LEA Performance on State Performance Plan (SPP) Targets". Archived from the original on 2011-08-24.
- Pennsylvania Department of Education, Testimony Hearing on Special Education Senate Republican Policy Committee, January 2013
- Pennsylvania Bureau of Special Education (January 31, 2011). "Blue Ridge School District Special Education Data Report LEA Performance on State Performance Plan (SPP) Targets School Year 2008-2009" (PDF). Archived from the original (PDF) on April 23, 2012.
- Blue Ridge School District (2010–2011). "Blue Ridge School District Special Education Department - Annual Public Notice of Special Education Services". Archived from the original on 2011-08-12. Retrieved 2011-03-29.
- Eleanor Chute., Modified PSSA test in math offered for 1st time, Pittsburgh Post-Gazette, April 18, 2010
- "PSSA and Keystone Exam Accommodation Guidelines for Students with IEPs and 504 Plans". 2015. Archived from the original on 2015-10-25.
- Pennsylvania Department of Education (December 12, 2014). "PSSA/ Keystone Accommodations Guidelines (PDE) 2015".
- Pennsylvania Department of Education. "Pennsylvania Special Education Funding".
- Senator Patrick Browne (November 1, 2011). "Senate Education Committee Holds Hearing on Special Education Funding & Accountability". Archived from the original on 2012-07-23.
- Pennsylvania Department of Education Amy Morton, Executive Deputy Secretary (November 11, 2011). "Public Hearing: Special Education Funding & Accountability Testimony". Archived from the original on 2012-04-22.CS1 maint: uses authors parameter (link)
- Baruch Kintisch Education Law Center (November 11, 2011). "Public Hearing: Special Education Funding & Accountability Testimony" (PDF). Archived from the original (PDF) on 2012-04-22.
- Amy Morton, Executive Deputy Secretary, Public Hearing: Special Education Funding & Accountability Testimony, Pennsylvania Department of Education, November 11, 2011
- US Department of Education (January 25, 2013). "U.S. Department of Education Clarifies Schools' Obligation to Provide Equal Opportunity to Students with Disabilities to Participate in Extracurricular Athletics".CS1 maint: uses authors parameter (link)
- Pennsylvania Department of Education (July 2010). "Special Education Funding from Pennsylvania State_2010-2011".
- Pennsylvania Department of Education (2011). "Special Education Funding 2011-2012 Fiscal Year".
- Pennsylvania Department of Education, Special Education funding report by LEA, July 2014
- Special Education Funding Reform Commission (December 11, 2015). "Special Education Funding Reform Commission Report" (PDF).
- Pennsylvania Department of Education (December 1, 2009). "Gifted Students as Percentage of Total Enrollment by School District/Charter School" (PDF). Archived from the original (PDF) on 2016-03-04.
- Pennsylvania Department of Education and Pennsylvania School Board. "CHAPTER 16. Special Education For Gifted Students". Retrieved February 4, 2011.CS1 maint: uses authors parameter (link)
- Pennsylvania Department of Education, Blue Ridge School District Enrollment and Projections, January 2009
- Research Analyzes Rural School District Enrollment and Building Capacity
- "Research Analyzes Rural School District Enrollment and Building Capacity", The Center for Rural Pennsylvania. October 2009.
- Edward Rendell; Governor and Mary Soderberg; Secretary of the Budget. (February 2009). "2009–10 Executive Budget Facts Pennsylvania School District Consolidation".
- Murphy, Jan (February 4, 2009). "Rendell calls for consolidation of state school districts". The Patriot-News.
- Standard and Poors (2007). "Pennsylvania Legislative Budget and Finance Committee Study - Study of the Cost-Effectiveness of Consolidating Pennsylvania School Districts part 2" (PDF). Archived from the original (PDF) on 2011-07-26.
- Standard and Poors (2007). "Pennsylvania Legislative Budget and Finance Committee Study - Study of the Cost-Effectiveness of Consolidating Pennsylvania School Districts part 1" (PDF). Archived from the original (PDF) on 2011-07-26.
- "Report of the Fiscal Responsibility Task Force" (PDF). Retrieved April 2011. Check date values in:
|access-date=(help)
Susquehanna County, Pennsylvania Schools | |||||||||||
|---|---|---|---|---|---|---|---|---|---|---|---|
| |||||||||||
| |||||||||||