Demographics of Puerto Rico
The population of Puerto Rico has been shaped by Amerindian settlement, European colonization especially under the Spanish Empire, slavery and economic migration. This article is about the demographic features of the population of Puerto Rico, including population density, ethnicity, education of the populace, health of the populace, economic status, religious affiliations and other aspects of the population.
| Demographics of Puerto Rico | |
|---|---|
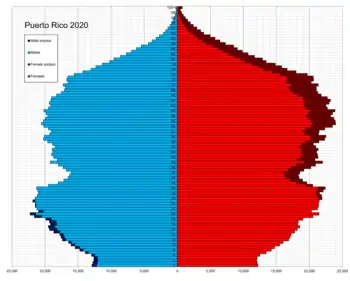 Puerto Rico population pyramid in 2020 | |
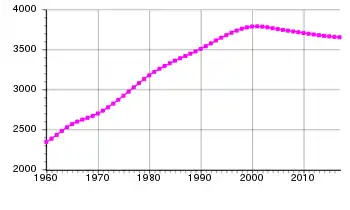 Population Change Timeline (1960–2017) | |
.jpg.webp) Population Density | |
| Population (2019) | 3,193,694 |
| Male population (2010) | 1,785,171 |
| Female population (2010) | 1,940,618 |
| Population growth | -1.32% |
| Birth rate | 7.5/1,000 |
| Death rate | 9.4/1,000 |
| Infant mortality rate | 8.24/1,000 |
| Life expectancy | 78.29 years |
| Nationality | Puerto Rican |
| Demographic bureaux | 2010 United States Census |
History of migration
| Year | Pop. | ±% |
|---|---|---|
| 1765 | 44,883 | — |
| 1775 | 70,250 | +56.5% |
| 1800 | 155,426 | +121.2% |
| 1815 | 220,892 | +42.1% |
| 1832 | 350,051 | +58.5% |
| 1846 | 447,914 | +28.0% |
| 1860 | 583,308 | +30.2% |
| 1877 | 731,648 | +25.4% |
| 1887 | 798,565 | +9.1% |
| 1899 | 953,243 | +19.4% |
| 1910 | 1,118,012 | +17.3% |
| 1920 | 1,299,809 | +16.3% |
| 1930 | 1,543,913 | +18.8% |
| 1940 | 1,869,255 | +21.1% |
| 1950 | 2,210,703 | +18.3% |
| 1960 | 2,349,544 | +6.3% |
| 1970 | 2,712,033 | +15.4% |
| 1980 | 3,196,520 | +17.9% |
| 1990 | 3,522,037 | +10.2% |
| 2000 | 3,808,610 | +8.1% |
| 2010 | 3,725,789 | −2.2% |
| 2020 | 3,285,874 | −11.8% |
| ||
Sometime between 400 B.C. and A.D. 100, the Arawak group of Amerindians inhabited Puerto Rico. Around A.D. 600, the Arawaks no longer lived on the island, perhaps because they had integrated with another culture or perhaps because they had been killed by illness.[4] By A.D. 1000, the indigenous Taíno inhabited the island. They called the island Borikén, which is popularly said to mean "land of the valiant one".[5][4] This is where the alternative name for Puerto Rico, Borinquen, comes from. Since the late 18th century Puerto Ricans have called themselves some variation of boricua, borincano and borinqueño to embrace their indigenous identity.[6] In the 15th century, the Carib lived on nearby islands and periodically invaded Taíno villages.[4]
Immigration
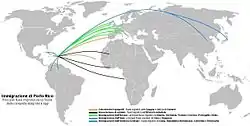
The Spanish conquered the island, assuming government in 1508, colonized it, and assumed hegemony over the natives. The Taíno population dwindled due to disease, tribal warfare, and forced labor, so the Spanish began importing large numbers of slaves from Africa. Spanish men arrived on the island disproportionately to Spanish women; African and Taíno women would sometimes marry them, resulting in a mixed tri-racial ethnicity.
In the late 18th century, the number of African slaves began to dwindle on the island. The British ban on slavery resulted in slave raids on Puerto Rico. Many slaves also escaped to neighboring islands.
During the 19th century large numbers of immigrants from Spain, as well as numerous Spaniards living in former Spanish colonies in South America, also arrived in Puerto Rico (See Spanish immigration to Puerto Rico). Large numbers of Canary Islanders (Isleños) also arrived in great numbers to the island; their influence can be seen today in Puerto Rico's culture, cuisine and most notably in the variety of Spanish that is spoken in Puerto Rico.
Although the vast majority of settlers came from Spain, Catholics from France, Ireland, Corsica, Italy, Germany and other European countries were also granted land by Spain as one of the provisions of the Real Cédula de Gracias de 1815 (Royal Decree of Graces of 1815). These immigrants were allowed to settle on the island, with a certain amount of free land and enslaved persons granted to them. In return, they had to profess fealty to the Spanish Crown. During the early 20th century Jews began to settle in Puerto Rico. The first large group of Jews to settle in Puerto Rico were European refugees fleeing German–occupied Europe in the late 1930s. Puerto Rico's economic boom of the 1950s attracted a considerable number of Jewish families from the U.S. mainland, who were joined after 1959 by an influx of Jewish emigres from Fidel Castro's Cuba.[7]
The mass immigration that occurred during the 19th century helped the population grow from 155,000 in 1800 to almost 1,000,000 at the close of the century.
Emigration
Emigration has been a major part of Puerto Rico's recent history as well. Starting in the post-World War II period waves of Puerto Ricans moved to the continental United States, particularly to New York City; Newark, Jersey City, Paterson, and Camden, New Jersey; Providence, Rhode Island; Springfield; Hartford and New Haven, Connecticut; Boston, Massachusetts; Orlando, Miami and Tampa, Florida; Philadelphia and Reading, Pennsylvania; Washington, D.C., Chicago and Los Angeles, California. This continued even as Puerto Rico's economy improved and its birth rate declined.
Vital statistics
| Average population | Live births | Deaths | Natural change | Crude birth rate (per 1000) | Crude death rate (per 1000) | Natural change (per 1000) | TFR | |
|---|---|---|---|---|---|---|---|---|
| 1910 | 1,118,000 | 37,600 | 26,600 | 11,000 | 33.6 | 23.8 | 9.8 | |
| 1911 | 1,140,000 | 39,100 | 26,600 | 12,500 | 34.3 | 23.3 | 11.0 | |
| 1912 | 1,150,000 | 40,400 | 26,900 | 13,500 | 35.1 | 23.4 | 11.7 | |
| 1913 | 1,170,000 | 42,700 | 23,200 | 19,500 | 36.5 | 19.8 | 16.7 | |
| 1914 | 1,190,000 | 47,400 | 22,300 | 25,100 | 39.8 | 18.7 | 21.1 | |
| 1915 | 1,210,000 | 45,000 | 25,000 | 20,000 | 37.2 | 20.7 | 16.5 | |
| 1916 | 1,230,000 | 43,200 | 29,400 | 13,800 | 35.1 | 23.9 | 11.2 | |
| 1917 | 1,250,000 | 44,300 | 38,600 | 5,700 | 35.4 | 30.9 | 4.5 | |
| 1918 | 1,260,000 | 51,500 | 38,900 | 12,600 | 40.9 | 30.9 | 10.0 | |
| 1919 | 1,280,000 | 46,000 | 30,300 | 15,700 | 35.9 | 23.7 | 12.2 | |
| 1920 | 1,300,000 | 49,900 | 29,600 | 20,300 | 38.4 | 22.8 | 15.6 | |
| 1921 | 1,320,000 | 50,600 | 29,700 | 20,900 | 38.3 | 22.5 | 15.8 | |
| 1922 | 1,350,000 | 50,500 | 29,400 | 21,100 | 37.4 | 21.8 | 15.6 | |
| 1923 | 1,370,000 | 50,700 | 26,900 | 23,800 | 37.0 | 19.6 | 17.4 | |
| 1924 | 1,400,000 | 53,600 | 27,200 | 26,400 | 38.3 | 19.4 | 18.9 | |
| 1925 | 1,420,000 | 52,700 | 33,200 | 19,500 | 37.1 | 23.4 | 13.7 | |
| 1926 | 1,450,000 | 55,500 | 32,300 | 23,200 | 38.3 | 22.3 | 16.0 | |
| 1927 | 1,470,000 | 58,200 | 33,500 | 24,700 | 39.6 | 22.8 | 16.8 | |
| 1928 | 1,500,000 | 52,900 | 29,700 | 23,200 | 35.3 | 19.8 | 15.5 | |
| 1929 | 1,520,000 | 52,300 | 40,700 | 11,600 | 34.4 | 26.8 | 7.6 | |
| 1930 | 1,544,000 | 54,300 | 31,500 | 22,800 | 35.2 | 20.4 | 14.8 | |
| 1931 | 1,580,000 | 71,600 | 35,200 | 36,400 | 45.3 | 22.3 | 23.0 | |
| 1932 | 1,615,000 | 66,400 | 35,500 | 30,900 | 41.1 | 22.0 | 19.1 | |
| 1933 | 1,647,000 | 61,600 | 36,700 | 24,900 | 37.4 | 22.3 | 15.1 | |
| 1934 | 1,679,000 | 65,595 | 31,684 | 33,911 | 39.1 | 18.9 | 20.2 | |
| 1935 | 1,710,000 | 67,585 | 30,748 | 36,837 | 39.5 | 18.0 | 21.5 | |
| 1936 | 1,743,000 | 68,962 | 34,790 | 34,172 | 39.6 | 20.0 | 19.6 | |
| 1937 | 1,777,000 | 67,919 | 37,132 | 30,787 | 38.2 | 20.9 | 17.3 | |
| 1938 | 1,810,000 | 69,823 | 33,870 | 35,953 | 38.6 | 18.7 | 19.9 | |
| 1939 | 1,844,000 | 73,044 | 32,631 | 40,413 | 39.6 | 17.7 | 21.9 | |
| 1940 | 1,879,000 | 72,388 | 34,477 | 37,911 | 38.5 | 18.3 | 20.2 | |
| 1941 | 1,926,000 | 76,130 | 35,551 | 40,579 | 39.5 | 18.5 | 21.1 | |
| 1942 | 1,973,000 | 78,405 | 32,218 | 46,187 | 39.7 | 16.3 | 23.4 | |
| 1943 | 2,012,000 | 77,304 | 29,065 | 48,239 | 38.4 | 14.4 | 24.0 | |
| 1944 | 2,037,000 | 82,534 | 29,843 | 52,691 | 40.5 | 14.7 | 25.9 | |
| 1945 | 2,070,000 | 86,680 | 28,837 | 57,843 | 41.9 | 13.9 | 27.9 | |
| 1946 | 2,100,000 | 88,421 | 27,517 | 60,904 | 42.1 | 13.1 | 29.0 | |
| 1947 | 2,149,000 | 91,305 | 25,407 | 65,898 | 42.5 | 11.8 | 30.7 | |
| 1948 | 2,187,000 | 87,809 | 26,209 | 61,600 | 40.2 | 12.0 | 28.2 | |
| 1949 | 2,197,000 | 85,625 | 23,389 | 62,236 | 39.0 | 10.6 | 28.3 | |
| 1950 | 2,218,000 | 86,038 | 21,895 | 64,143 | 38.8 | 9.9 | 27.9 | |
| 1951 | 2,210,000 | 84,076 | 22,374 | 61,702 | 38.0 | 10.1 | 27.9 | |
| 1952 | 2,212,000 | 80,438 | 20,480 | 59,958 | 36.3 | 9.3 | 27.1 | |
| 1953 | 2,221,000 | 77,754 | 17,972 | 59,782 | 35.0 | 8.1 | 26.9 | |
| 1954 | 2,233,000 | 78,008 | 16,783 | 61,225 | 34.9 | 7.5 | 27.4 | |
| 1955 | 2,247,000 | 79,221 | 16,243 | 62,978 | 35.2 | 7.2 | 28.0 | |
| 1956 | 2,262,000 | 78,177 | 16,607 | 61,570 | 34.5 | 7.3 | 27.2 | |
| 1957 | 2,279,000 | 76,068 | 16,022 | 60,046 | 33.3 | 7.0 | 26.3 | |
| 1958 | 2,299,000 | 76,128 | 16,099 | 60,029 | 33.1 | 7.0 | 26.1 | |
| 1959 | 2,323,000 | 74,933 | 15,870 | 59,063 | 32.2 | 6.8 | 25.4 | |
| 1960 | 2,356,000 | 76,015 | 15,841 | 60,174 | 32.2 | 6.7 | 25.5 | |
| 1961 | 2,396,000 | 75,563 | 16,361 | 59,202 | 31.5 | 6.8 | 24.7 | |
| 1962 | 2,442,000 | 76,677 | 16,575 | 60,102 | 31.3 | 6.8 | 24.6 | |
| 1963 | 2,491,000 | 77,382 | 17,386 | 59,996 | 31.0 | 7.0 | 24.0 | |
| 1964 | 2,538,000 | 78,837 | 18,556 | 60,281 | 31.0 | 7.3 | 23.7 | |
| 1965 | 2,578,000 | 79,586 | 17,719 | 61,867 | 30.8 | 6.9 | 24.0 | |
| 1966 | 2,609,000 | 75,735 | 17,506 | 58,229 | 29.0 | 6.7 | 22.3 | |
| 1967 | 2,634,000 | 70,755 | 16,780 | 53,975 | 26.8 | 6.4 | 20.4 | |
| 1968 | 2,656,000 | 67,989 | 17,481 | 50,508 | 25.5 | 6.6 | 19.0 | |
| 1969 | 2,680,000 | 67,577 | 17,669 | 49,908 | 25.1 | 6.6 | 18.6 | |
| 1970 | 2,710,000 | 67,438 | 18,080 | 49,358 | 24.8 | 6.7 | 18.2 | 2.69 |
| 1971 | 2,746,000 | 71,114 | 18,144 | 52,970 | 25.8 | 6.6 | 19.2 | 2.82 |
| 1972 | 2,787,000 | 68,914 | 19,011 | 49,903 | 24.7 | 6.8 | 17.9 | 2.67 |
| 1973 | 2,833,000 | 68,821 | 19,257 | 49,564 | 24.2 | 6.8 | 17.5 | 2.67 |
| 1974 | 2,882,000 | 70,082 | 19,490 | 50,592 | 24.3 | 6.7 | 17.5 | 2.65 |
| 1975 | 2,932,000 | 69,691 | 19,073 | 50,618 | 23.7 | 6.5 | 17.2 | 2.61 |
| 1976 | 2,984,000 | 72,883 | 19,893 | 52,990 | 24.4 | 6.7 | 17.7 | 2.77 |
| 1977 | 3,037,000 | 75,151 | 19,895 | 55,256 | 24.7 | 6.5 | 18.2 | 2.93 |
| 1978 | 3,090,000 | 75,066 | 19,876 | 55,190 | 24.2 | 6.4 | 17.8 | 2.86 |
| 1979 | 3,141,000 | 73,781 | 20,390 | 53,391 | 23.4 | 6.5 | 17.0 | 2.77 |
| 1980 | 3,188,000 | 73,060 | 20,486 | 52,574 | 22.9 | 6.4 | 16.4 | 2.75 |
| 1981 | 3,230,000 | 71,365 | 21,197 | 50,168 | 22.0 | 6.5 | 15.5 | 2.64 |
| 1982 | 3,269,000 | 69,336 | 21,522 | 47,814 | 21.2 | 6.6 | 14.6 | 2.57 |
| 1983 | 3,305,000 | 65,742 | 21,499 | 44,243 | 19.8 | 6.5 | 13.4 | 2.44 |
| 1984 | 3,338,000 | 63,321 | 21,733 | 41,588 | 18.9 | 6.5 | 12.4 | 2.37 |
| 1985 | 3,370,000 | 63,629 | 23,194 | 40,435 | 18.8 | 6.9 | 12.0 | 2.34 |
| 1986 | 3,400,000 | 63,551 | 23,387 | 40,164 | 18.6 | 6.9 | 11.8 | 2.31 |
| 1987 | 3,429,000 | 64,393 | 23,954 | 40,439 | 18.7 | 7.0 | 11.8 | 2.27 |
| 1988 | 3,457,000 | 64,081 | 25,123 | 38,958 | 18.5 | 7.2 | 11.2 | 2.27 |
| 1989 | 3,487,000 | 66,692 | 25,987 | 40,705 | 19.1 | 7.4 | 11.6 | 2.36 |
| 1990 | 3,518,000 | 66,565 | 26,138 | 40,407 | 18.9 | 7.4 | 11.5 | 2.35 |
| 1991 | 3,552,000 | 64,498 | 26,321 | 38,177 | 18.2 | 7.4 | 10.7 | 2.20 |
| 1992 | 3,587,000 | 64,471 | 27,389 | 37,082 | 18.0 | 7.6 | 10.3 | 2.18 |
| 1993 | 3,623,000 | 65,258 | 28,493 | 36,765 | 18.0 | 7.9 | 10.1 | 2.14 |
| 1994 | 3,657,000 | 64,341 | 28,428 | 35,913 | 17.6 | 7.8 | 9.8 | 2.08 |
| 1995 | 3,690,000 | 63,502 | 30,184 | 33,318 | 17.2 | 8.2 | 9.0 | 2.08 |
| 1996 | 3,719,000 | 63,259 | 29,871 | 33,388 | 17.0 | 8.0 | 9.0 | 2.06 |
| 1997 | 3,747,000 | 64,214 | 29,119 | 35,095 | 17.1 | 7.8 | 9.4 | 2.13 |
| 1998 | 3,770,000 | 60,518 | 29,990 | 30,528 | 16.1 | 8.0 | 8.1 | 1.98 |
| 1999 | 3,787,000 | 59,684 | 29,145 | 30,539 | 15.8 | 7.7 | 8.1 | 1.94 |
| 2000 | 3,797,000 | 59,460 | 28,550 | 30,910 | 15.7 | 7.5 | 8.1 | 1.93 |
| 2001 | 3,799,000 | 55,982 | 28,794 | 27,188 | 14.7 | 7.6 | 7.2 | 1.85 |
| 2002 | 3,795,000 | 52,871 | 28,098 | 24,773 | 13.9 | 7.4 | 6.5 | 1.77 |
| 2003 | 3,785,000 | 50,803 | 28,356 | 22,447 | 13.4 | 7.5 | 5.9 | 1.71 |
| 2004 | 3,773,000 | 51,239 | 29,066 | 22,173 | 13.6 | 7.7 | 5.9 | 1.74 |
| 2005 | 3,761,000 | 50,687 | 29,702 | 20,985 | 13.5 | 7.9 | 5.6 | 1.73 |
| 2006 | 3,750,000 | 48,597 | 28,206 | 20,391 | 13.0 | 7.5 | 5.4 | 1.67 |
| 2007 | 3,739,000 | 46,642 | 29,169 | 17,473 | 12.5 | 7.8 | 4.7 | 1.64 |
| 2008 | 3,729,000 | 45,620 | 29,050 | 16,570 | 11.5 | 7.8 | 3.7 | 1.62 |
| 2009 | 3,719,000 | 44,773 | 29,005 | 15,768 | 11.3 | 7.8 | 3.5 | 1.59 |
| 2010 | 3,722,000 | 42,153 | 29,153 | 13,000 | 11.3 | 7.8 | 3.5 | 1.62 |
| 2011 | 3,679,000 | 41,080 | 29,742 | 11,338 | 11.2 | 8.1 | 3.1 | 1.60 |
| 2012 | 3,634,000 | 38,900 | 29,448 | 9,228 | 10.7 | 8.1 | 2.5 | 1.54 |
| 2013 | 3,593,000 | 38,986 | 29,009 | 9,977 | 10.9 | 8.1 | 2.8 | 1.47 |
| 2014 | 3,535,000 | 34,485 | 30,224 | 4,261 | 9.8 | 8.5 | 1.2 | 1.43 |
| 2015 | 3,474,000 | 31,157 | 28,279 | 2,878 | 9.0 | 8.1 | 0.9 | 1.34 |
| 2016 | 3,411,000 | 27,406 | 29,613 | −2,207 | 8.3 | 8.7 | −0.4 | 1.24 |
| 2017 | 3,337,000 | 23,582 | 30,977 | −7,395 | 7.3 | 9.3 | −2.0 | 1.10 |
| 2018 | 3,193,354 | 21,424 | 29,109 | −7,685 | 6.7 | 9.1 | −2.4 | 1.04 |
| 2019 | 3,193,694 | 20,409 | 29,638 | -9,229 | 6.4 | 9.3 | −2.9 | 0.98 |
| 2020 | 3,285,874 | 18,896 | 31,679 | -12,783 | 5.8 | 9.6 | −3.8 | |
Current vital statistics
| Period | Live births | Deaths | Natural increase |
|---|---|---|---|
| January - June 2020 | 9,142 | 15,414 | -6,272 |
| January - June 2021 | 8,519 | 16,349 | -7,830 |
| Difference |  -623 (-6.81%) -623 (-6.81%) |
 +935 (+6.07%) +935 (+6.07%) |
-1,558 |
Structure of the population
Structure of the population (01.07.2012) (Estimates) (Data refer to projections based on the 2010 Population Census):[13]
| Age Group | Male | Female | Total | % |
|---|---|---|---|---|
| Total | 1,755,479 | 1,911,605 | 3,667,084 | 100 |
| 0–4 | 107 000 | 102 597 | 209 597 | 5.72 |
| 5–9 | 116 188 | 109 665 | 225 853 | 6.16 |
| 10–14 | 129 722 | 123 006 | 252 728 | 6.89 |
| 15–19 | 138 646 | 132 250 | 270 896 | 7.39 |
| 20–24 | 134 894 | 131 768 | 266 662 | 7.27 |
| 25–29 | 112 981 | 117 257 | 230 238 | 6.28 |
| 30–34 | 115 030 | 125 281 | 240 311 | 6.55 |
| 35–39 | 111 971 | 121 837 | 233 808 | 6.38 |
| 40–44 | 113 223 | 123 276 | 236 499 | 6.45 |
| 45–49 | 114 114 | 129 441 | 243 555 | 6.64 |
| 50–54 | 109 550 | 127 211 | 236 761 | 6.46 |
| 55–59 | 103 031 | 123 108 | 226 139 | 6.17 |
| 60–64 | 96 256 | 115 745 | 212 001 | 5.78 |
| 65–69 | 86 858 | 104 308 | 191 166 | 5.21 |
| 70–74 | 64 745 | 79 593 | 144 338 | 3.94 |
| 75–79 | 46 652 | 60 431 | 107 083 | 2.92 |
| 80–84 | 29 398 | 41 911 | 71 309 | 1.94 |
| 85+ | 25 220 | 42 290 | 68 140 | 1.86 |
| Age group | Male | Female | Total | Percent |
|---|---|---|---|---|
| 0–14 | 352 910 | 335 268 | 688 178 | 18.77 |
| 15–64 | 1,149,696 | 1,247,174 | 2,396,870 | 65.36 |
| 65+ | 252 873 | 329 163 | 582 036 | 15.87 |
Life expectancy
| Period | Life expectancy in
Years |
Period | Life expectancy in
Years |
|---|---|---|---|
| 1950–1955 | 63.5 | 1985–1990 | 74.6 |
| 1955–1960 | 67.9 | 1990–1995 | 73.8 |
| 1960–1965 | 69.1 | 1995–2000 | 74.9 |
| 1965–1970 | 70.7 | 2000–2005 | 76.8 |
| 1970–1975 | 72.4 | 2005–2010 | 77.8 |
| 1975–1980 | 73.5 | 2010–2015 | 79.2 |
| 1980–1985 | 73.9 |
Source: UN World Population Prospects[14]
Race and ethnic group
| Racial groups – Puerto Rico[15][16][17][18][19] | ||
|---|---|---|
| Year | White % | Non-White % |
| 1802 | 42.0 | 58.0 |
| 1812 | 40.8 | 59.2 |
| 1820 | 39.4 | 60.6 |
| 1830 | 45.1 | 54.9 |
| 1877 | 52.3 | 47.7 |
| 1887 | 53.5 | 46.5 |
| 1897 | 64.3 | 35.7 |
| 1899 | 61.8 | 38.2 |
| 1910 | 64.5 | 35.5 |
| 1920 | 72.0 | 28.0 |
| 1930 | 73.3 | 26.7 |
| 1935 | 75.2 | 24.8 |
| 1940 | 76.0 | 24.0 |
| 1950 | 79.7 | 20.3 |
| 2000 | 80.5 | 19.5 |
| 2010 | 75.8 | 24.2 |
| 2020 | 16.5
(Hispanic Only) |
83.5 |
| Racial composition of the Puerto Rican population, by the census, 1802–2020. | ||
Race and origin history
The first census by the United States in 1899 reported a population of 953,243 inhabitants, 61.8% of them classified as white, 31.9% as mixed, and 6.3% as black. The last census by the United States in 2020 reported 49.8% as mixed, 25.5% as some other race, 17.1% as white, 7.0% as black, and 0.5% as indigenous.
A strong European immigration wave and large importation of slaves from Africa helped increase the population of Puerto Rico sixfold during the 19th century. No major immigration wave occurred during the 20th century.[20]
In the late 1700s, Puerto Rico had laws like the Regla del Sacar or Gracias al Sacar where a person of mixed ancestry could be considered legally white so long as they could prove that at least one person per generation in the last four generations had also been legally white. Therefore, people of mixed ancestry with known white lineage were classified as white, the opposite of the "one-drop rule" in the United States.[21]
Genetic studies
| Island Identity survey – 2000 census[22] | ||
|---|---|---|
| Island Identity | % of Total | |
| Puerto Rican | 69% | |
| American | 2.5% | |
| Spaniard | 2.1% | |
| Dominican | 1.7% | |
| Hispanic | 0.8% | |
Puerto Ricans, on average, have genetic contributions from Europeans, North Africans, West Africans, and Native Americans.[23] The island has a higher degree of tri-hybrid admixture than most countries in Latin America. A recent study of DNA in a census-based sample of 642 Puerto Rican individuals, demonstrated that almost all modern Puerto Ricans are admixed descendants of the three ancestral populations (Taínos, Europeans, and Africans). The study shows that the average Puerto Rican on the Eastern region is 54.7% European, 31.8% African, and 13.5% Native American, while the average Puerto Rican on the Western Region is 68.5% European, 15.9% African, and 15.6% Native American. The highest indigenous ancestry recorded in the study was nearly 40%.[24]
Women in the diaspora
In a study done on Puerto Rican women (of all races) born on the island but living in New York by Carolina Bonilla, Mark D. Shriver and Esteban Parra in 2004, the ancestry proportions corresponding to the three parental populations were found to be 53.3±2.8% European, 29.1±2.3% West African, and 17.6±2.4% Native American based on autosomal ancestry informative markers. Although autosomal markers tests seem to draw a more broad picture than that of single, gender-based mtDNA and Y-Chromosome tests, the problem with autosomal DNA is in the archaic categories used: "European", "Sub-Saharan African", "East Asian" & "Native American". "Asian" (South, North or East) & "North African" are not included. These generalized categories may not take into account the complexity of migratory patterns across the Old World. The study also found that, from the women sampled, 98% had European ancestry markers, 87% had African ancestry markers, 84% had Native American ancestry markers, 5% showed only African and European markers, 4% showed mostly Native American and European markers, 2% showed only African markers, and 2% showed mostly European markers.[25]
Religion
There are many religious beliefs represented in the island with Christianity as the religion indicated by the majority in 2010.
Religious breakdown in Puerto Rico (2010):[26]
Christians
A recent report providing a full breakdown as to specific religions is not available; the most recent was for 2006.
The Christian Denominational Breakdown was as follows in 2006:[27]
| Denomination | Adherents |
|---|---|
| Catholic | 1,650,000 |
| Other Pentecostal | 229,814 |
| Pentecostal Church of God | 100,000 |
| Assemblies of God | 56,000 |
| Baptist Convention | 35,000 |
| Seventh-day Adventist | 31,524 |
| Jehovah's Witnesses | 25,778 |
| Church of God (Cleveland) | 17,500 |
| Defenders of the Faith | 17,500 |
| The Church of Jesus Christ of Latter-day Saints | 16,084 |
| Disciples of Christ | 10,778 |
| United Methodist | 10,000 |
| Boriquen Presby Synod | 8,300 |
| Christian and Missionary Alliance | 6,500 |
| Church of the Nazarene | 2,994 |
| Other | 130,400 |
Catholics
The Roman Catholic Church has been historically the most dominant religion of the majority of Puerto Ricans, with Puerto Rico having the first dioceses in the Americas.[28] This religion was brought by Spanish colonists. The first dioceses in the Americas, including that of Puerto Rico, were authorized by Pope Julius II in 1511.[29] One Pope, John Paul II, visited Puerto Rico in October 1984. All municipalities in Puerto Rico have at least one Catholic Church, most of which are located at the town center or "plaza".
An Associated Press article in March 2014 stated that "more than 70 percent of whom identify themselves as Catholic" but provided no source for this information. (It may have been using the 2010 Pew Research Center data.)[30]
The CIA World Factbook however, reports that 85% of the population of Puerto Rico identifies as Roman Catholic, while 15% identify as Protestant and Other. Neither a date or a source for that information is provided and may not be recent.[31]
In November 2014, a Pew Research report, with the sub-title Widespread Change in a Historically Catholic Region, indicated that only 56% of Puerto Ricans were Catholic and that 33% were Protestant. This survey was completed between October 2013 and February 2014.
Protestants
Protestantism was suppressed under the Spanish Catholic regime. For example, the Holy Trinity Anglican church in Ponce, was prevented from ringing its bell until 1898, when American troops landed there.[32] Protestantism increased under American sovereignty, making contemporary Puerto Rico more interconfessional than in previous centuries, although Catholicism continues to be the dominant religion. The first Protestant church, Iglesia de la Santísima Trinidad, was established in Ponce by the Anglican Diocese of Antigua in 1872.[33] It was the first non-Roman Catholic Church in the entire Spanish Empire in the Americas.[34][35]
Muslims
In 2007, there were over 5,000 Muslims in Puerto Rico, representing about 0.13% of the population.[36][37] There are eight Islamic mosques spread throughout the island, with most Muslims living in Río Piedras.[38][39] Puerto Rican converts to Islam continue to occur.[40] "Ties between Latinos and Islam are more than just spiritual, but date back to Spanish history. Many people do not realize that Muslims conquered Spain".[41] And at times not just individuals, but whole families convert. However, lack of Muslim education in the Island forces some Puerto Rican Muslims to migrate to the States.[41] Islam was brought into Puerto Rico mainly via the Palestinian migration of the 1950s and '60s.[42] Thus, today there is a strong Palestinian presence among Muslims in Puerto Rico. "They are economically strong and are thus able to pay for a full-time Imaam".[43]
Jews
Puerto Rico is also home to the largest Jewish community in the Caribbean with 3,000 Jewish inhabitants.[44] Some Puerto Ricans have converted, not only as individuals but as entire families. Puerto Rico is the only Caribbean island in which the Conservative, Reform and Orthodox Jewish movements are represented.[7][45]
Other religious practices
Taíno religious practices have been rediscovered/reinvented by a handful of advocates. Starting in about 1840, there have been attempts to create a quasi-indigenous Taíno identity in rural areas of Puerto Rico.[46] This trend accelerated among the Puerto Rican community in the mainland United States in the 1960s.[47] In the 2010 U.S. census, 9,399 people are identified as "Taíno."[48]
Various African religious practices have been present since the arrival of enslaved Africans. In particular, the Yoruba beliefs of Santería and/or Ifá, and the Kongo-derived Palo Mayombe (sometimes called an African belief system, but rather a way of Bantu lifestyle of Congo origin) find adherence among the few individuals who practice some form of African traditional religion.
Demographic statistics
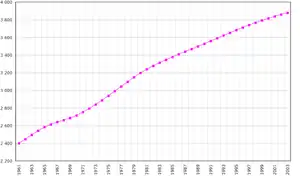
The following demographic statistics are from the CIA World Factbook unless otherwise indicated.
Population in 2010:
- 3,725,789 (2010 U.S. Census)
Population in 2016:
Gender:[51]
- Men: 1,785,171
- Women: 1,940,618
Age structure:
- 0–17 years:
- 24.2% (903,295)
- 18–24 years:
- 10.1% (375,175)
- 25–34 years:
- 13.2% (492,332)
- 35–49 years:
- 19.6% (731,514)
- 50–64 years:
- 18.3% (681,505)
- 65 years and over:
- 14.6% (541,998)
Infant mortality rate:
- Total
- 8.23 deaths/1,000 live births
- Male
- Deaths/1,000 live births
- Female
- 7.43 deaths/1,000 live births (2010 est.)
Life expectancy at birth:
- Total population:
- 78.77 years
- Male:
- 75.15 years
- Female:
- 82.57 years (2010 est.)
Total fertility rate:
- 1.62 children born/woman (2010 est.)
Nationality:[52]
- Noun: Puerto Rican(s) (US citizens)
- Adjective: Puerto Rican
Ethnic Groups (2010):[52]
- White 75.8%
- Black/African 12.4%
- Other 8.5% (includes American Indian, Alaskan Native, Native Hawaiian, Other Pacific Islander, and Others)
- Mixed 3.3%
Religions:[26]
- Roman Catholic 69.7%
- Protestant and Other Christian 27%
Languages:[52]
- Spanish (main language)
- English
Median Household Income:[50]
- $19,350 (2015 est.)
Individuals below the poverty level:[50]
- 45.5% (2015 est.)
Education, high school graduate or higher:[50]
- 73% (2015 est.)
See also
 Puerto Rico portal
- Puerto Rican people
- Stateside Puerto Ricans
- Demographics of the United States
- Puerto Rican citizenship
- Outline of Puerto Rico
- Cultural diversity in Puerto Rico
- Index of Puerto Rico-related articles
- History of women in Puerto Rico
- Military history of Puerto Rico
- National Register of Historic Places listings in Puerto Rico
- Homelessness in Puerto Rico
References
- "Puerto Rico Population History, 1765–2000". Welcome.topuertorico.org. Retrieved October 14, 2017.
- "Resident Population Data". Census. US: Government. 2010. Archived from the original on October 19, 2013. Retrieved January 2, 2014.
- "World Population Clock: 7.9 Billion People (2021) - Worldometer".
- Stacy., Taus-Bolstad (January 1, 2005). Puerto Ricans in America. Lerner Publications Co. ISBN 9780822539537. OCLC 54046670 – via Google Books.
- "Puerto Rico – History and Heritage". Smithsonianmag.com. Smithson Institution. Retrieved January 30, 2017.
- 1969–, Brown, Monica (January 1, 2002). Gang nation : delinquent citizens in Puerto Rican, Chicano, and Chicana narratives. University of Minnesota Press. ISBN 0816634785. OCLC 48649774.CS1 maint: numeric names: authors list (link)
- "Puerto Rico Virtual Jewish History Tour". Jewishvirtuallibrary.org. Retrieved October 14, 2017.
- B.R. Mitchell. International historical statistics: the Americas, 1750–2000.
- "United Nations Statistics Division – Demographic and Social Statistics". Unstats.un.org. Retrieved October 14, 2017.
- "Archived copy". Archived from the original on September 27, 2017. Retrieved September 9, 2017.CS1 maint: archived copy as title (link)
- "Archived copy" (PDF). Archived from the original (PDF) on October 16, 2017. Retrieved October 3, 2017.CS1 maint: archived copy as title (link)
- "Vital Statistics Rapid Release – State and National Provisional Counts". Centers for Disease Control and Prevention.
- "United Nations Statistics Division – Demographic and Social Statistics". Unstats.un.org. Retrieved October 14, 2017.
- "World Population Prospects – Population Division – United Nations". Archived from the original on September 19, 2016. Retrieved July 15, 2017.
- "Puerto Rico's History on race" (PDF). Ssc.wisc.edu. Archived from the original (PDF) on February 7, 2012. Retrieved October 14, 2017.
- "The World Factbook — Central Intelligence Agency". Cia.gov. Retrieved October 14, 2017.
- 2010.census.gov Archived March 24, 2011, at the Wayback Machine
- "Racial Amnesia". March 3, 2016. Archived from the original on March 3, 2016. Retrieved October 14, 2017.
- "Mitochondrial DNA analysis reveals substanial [sic] Native American ancestry in Puerto Rico Human Biology – Find Articles". June 8, 2007. Archived from the original on June 8, 2007. Retrieved October 14, 2017.
- Not of Pure Blood. Jay Kinsbruner. Duke University Press. 1996. Page 22. Retrieved January 27, 2012.
- "Largest ethnic groups in Puerto Rico". Names.mongabay.com. March 3, 2004. Retrieved October 14, 2017.
- Tang, H; Choudhry, S; Mei, R; Morgan, M; Rodriguez-Cintron, W; Burchard, EG; Risch, NJ (2007). "Recent genetic selection in the ancestral admixture of Puerto Ricans". Am. J. Hum. Genet. 81 (3): 626–33. doi:10.1086/520769. PMC 1950843. PMID 17701908.
- Via, Marc; Gignoux, Christopher R.; Roth, Lindsey A.; Fejerman, Laura; Galanter, Joshua; Choudhry, Shweta; Toro-Labrador, Gladys; Viera-Vera, Jorge; Oleksyk, Taras K.; Beckman, Kenneth; Ziv, Elad (January 31, 2011). "History Shaped the Geographic Distribution of Genomic Admixture on the Island of Puerto Rico". PLOS ONE. 6 (1): e16513. doi:10.1371/journal.pone.0016513. ISSN 1932-6203. PMC 3031579. PMID 21304981.
- Bonilla et al., Ancestral proportions and their association with skin pigmentation and bone mineral density in Puerto Rican women from New York City. Hum Gen (2004) 115: 57–58 Available at: "Archived copy" (PDF). Archived from the original (PDF) on January 14, 2009. Retrieved March 30, 2014.CS1 maint: archived copy as title (link) [Date of access: May 30, 2008]
- "Demography – Puerto Rico". Pew Research. Pew Research, DC. January 2017. Retrieved February 18, 2017.
- Denominations Retrieved June 9, 2009. Archived January 17, 2009, at the Wayback Machine
- "Porto Rico". En.wikisource.org. Retrieved October 14, 2017.
- Herbermann, Charles, ed. (1913). . Catholic Encyclopedia. New York: Robert Appleton Company.
- Associated Press (March 12, 2014). "Catholic Church and Puerto Rico officials at odds in widening sex abuse investigation". FOX News. FOX News. Retrieved February 17, 2017.
- "Puerto Rico – People and Society". CIA Library. CIA. 2015. Retrieved February 17, 2017.
Roman Catholic 85%, Protestant and other 15%
- "Religion in Puerto Rico – By Puerto Rico Channel". Puertorico.com. Retrieved October 14, 2017.
- "Sobre Nosotros". Episcopalpr.org. Archived from the original on March 17, 2010. Retrieved February 6, 2011.
- Luis Fortuño Janeiro. Album Histórico de Ponce (1692–1963). Page 165. Ponce, Puerto Rico: Imprenta Fortuño. 1963.
- "La presencia Germanica en Puerto Rico". Preb.com. Retrieved February 6, 2011.
- Institute of Islamic Information and Education: Number of Muslims and Percentage in Puerto Rico Retrieved June 11, 2009. Corrected October 6, 2009.
- Percent Puerto Rican population that are Muslims Archived September 27, 2007, at the Wayback Machine Retrieved June 8, 2009.
- Muslim mosques in Puerto Rico Archived August 5, 2012, at archive.today Retrieved June 8, 2009.
- "Saudi Aramco World : Muslims in the Caribbean". Saudiaramcoworld.com. Archived from the original on May 27, 2012. Retrieved October 14, 2017.
- "Puerto Rican Converts". Discoveringislam.org. Retrieved October 14, 2017.
- Reshaping One Nation Under God Retrieved June 8, 2009. Archived May 17, 2009, at the Wayback Machine
- Palestinian migration Retrieved June 8, 2009. Archived October 7, 2011, at the Wayback Machine
- "Archived copy". Archived from the original on October 23, 2007. Retrieved June 9, 2009.CS1 maint: archived copy as title (link)
- "The Jewish Palate: The Jews of Puerto Rico". The Jerusalem Post. Retrieved August 9, 2016.
- "Luxner – Articles". Luxner.com. Archived from the original on November 7, 2005. Retrieved October 14, 2017.
- "Taíno: Indigenous Caribbeans – Black History Month 2017". Black History Month 2017. Retrieved February 6, 2018.
- Alexandra Aikhenvald (2012) Languages of the Amazon, Oxford University Press
- "American Indian and Alaska Native Tribes in the United States and Puerto Rico: 2010 (CPH-T-6)". Census.gov. Census bureau. 2010. Retrieved September 14, 2016.
- "Population Estimates, Population Change, and Components of Change". US Census. US Census. January 12, 2017. Retrieved February 18, 2016.
Annual Estimates of the Resident Population for the United States, Regions, States, and Puerto Rico: April 1, 2010 to July 1, 2016 (NST-EST2016-01)
- "U.S. Census website". US Census. Department of Commerce. 2016. Retrieved February 18, 2017.
- "2006 Survey Archived June 8, 2011, at the Wayback Machine
- "Central America and Caribbean :: PUERTO RICO". CIA The World Factbook.
Bibliography
- "Population and Society in Puerto Rico from the Spanish Colonial Era to 1940: A Select Bibliography". Caribbean Studies. University of Puerto Rico. 35 (2): 155–169. 2007. ISSN 0008-6533. JSTOR 25613118.
- Pyle, Sam; Celestine, Adia; Ging, Angela; Christy, Brooke (April 21, 2016). "Puerto Rico: A Sociological Analysis of Disparities in Hispanic Identification". Florida State University. Cite journal requires
|journal=(help)
External links
- The End of Slavery ...
- How Puerto Rico Became White: Racial analysis
- Puerto rico 2005 Fact finder statistics
- United Nations country profile
- Genetic Make-up of Puerto Ricans
- 1930s Sterilization of One Third of Puerto Rican Women by the Chicago Women's Liberation Union
| History |
| ||||||||
|---|---|---|---|---|---|---|---|---|---|
| Geography | |||||||||
| Ecology |
| ||||||||
| Politics | |||||||||
| Economy | |||||||||
| Society |
| ||||||||
