Fremont County, Iowa
Fremont County is a county located in the U.S. state of Iowa. As of the 2020 census the population was 6,605, making it the state's seventh-least populous county.[1] The county seat is Sidney.[2] The county was formed in 1847 and named for the military officer John C. Fremont.[3]
Fremont County | |
|---|---|
 Fremont County Courthouse | |
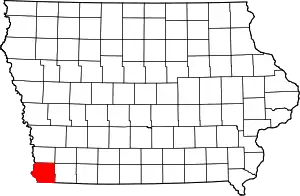 Location within the U.S. state of Iowa | |
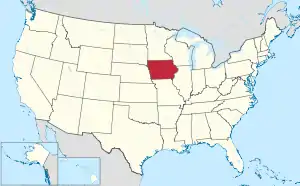 Iowa's location within the U.S. | |
| Coordinates: 40°44′38″N 95°36′31″W | |
| Country |  United States United States |
| State |  Iowa Iowa |
| Founded | 1847 |
| Named for | John C. Fremont |
| Seat | Sidney |
| Largest city | Hamburg |
| Area | |
| • Total | 517 sq mi (1,340 km2) |
| • Land | 511 sq mi (1,320 km2) |
| • Water | 5.5 sq mi (14 km2) 1.1% |
| Population (2020) | |
| • Total | 6,605 |
| • Density | 13/sq mi (4.9/km2) |
| Time zone | UTC−6 (Central) |
| • Summer (DST) | UTC−5 (CDT) |
| Congressional district | 3rd |
| Website | www |
Geography
According to the U.S. Census Bureau, the county has a total area of 517 square miles (1,340 km2), of which 511 square miles (1,320 km2) is land and 5.5 square miles (14 km2) (1.1%) is water.[4]
Major highways


.svg.png.webp)


Adjacent counties
- Mills County (north)
- Page County (east)
- Atchison County, Missouri (south)
- Otoe County, Nebraska (southwest)
- Cass County, Nebraska (northwest)
History
Fremont County was impacted by the 2019 Midwestern U.S. floods. Buyouts are under discussion for residents in Hamburg and McPaul.[5]
Demographics
| Historical population | |||
|---|---|---|---|
| Census | Pop. | %± | |
| 1850 | 1,244 | — | |
| 1860 | 5,074 | 307.9% | |
| 1870 | 11,174 | 120.2% | |
| 1880 | 17,652 | 58.0% | |
| 1890 | 16,842 | −4.6% | |
| 1900 | 18,546 | 10.1% | |
| 1910 | 15,623 | −15.8% | |
| 1920 | 15,447 | −1.1% | |
| 1930 | 15,533 | 0.6% | |
| 1940 | 14,645 | −5.7% | |
| 1950 | 12,323 | −15.9% | |
| 1960 | 10,282 | −16.6% | |
| 1970 | 9,282 | −9.7% | |
| 1980 | 9,401 | 1.3% | |
| 1990 | 8,226 | −12.5% | |
| 2000 | 8,010 | −2.6% | |
| 2010 | 7,441 | −7.1% | |
| 2020 | 6,605 | −11.2% | |
| U.S. Decennial Census[6] 1790-1960[7] 1900-1990[8] 1990-2000[9] 2010-2018[10] | |||
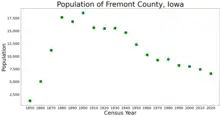
2020 census
The 2020 census recorded a population of 6,605 in the county, with a population density of 12.7663/sq mi (4.9291/km2). 95.65% of the population reported being of one race. 91.01% were non-Hispanic White, 0.17% were Black, 2.88% were Hispanic, 0.29% were Native American, 0.17% were Asian, 0.08% were Native Hawaiian or Pacific Islander and 5.42% were some other race or more than one race. There were 3,110 housing units, of which 2,720 were occupied.[1]
2010 census
The 2010 census recorded a population of 7,441 in the county, with a population density of 14.5599/sq mi (5.6216/km2). There were 3,431 housing units, of which 3,064 were occupied.[11]
2000 census
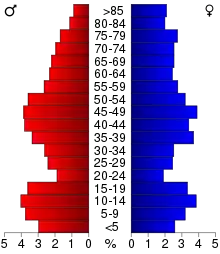
As of the census[12] of 2000, there were 8,010 people, 3,199 households, and 2,242 families residing in the county. The population density was 16 people per square mile (6/km2). There were 3,514 housing units at an average density of 7 per square mile (3/km2). The racial makeup of the county was 98.01% White, 0.04% Black or African American, 0.24% Native American, 0.24% Asian, 0.96% from other races, and 0.51% from two or more races. 2.17% of the population were Hispanic or Latino of any race.
There were 3,199 households, out of which 30.20% had children under the age of 18 living with them, 58.90% were married couples living together, 8.20% had a female householder with no husband present, and 29.90% were non-families. 26.30% of all households were made up of individuals, and 14.90% had someone living alone who was 65 years of age or older. The average household size was 2.45 and the average family size was 2.93.
In the county, the population was spread out, with 25.10% under the age of 18, 6.00% from 18 to 24, 24.30% from 25 to 44, 24.70% from 45 to 64, and 19.80% who were 65 years of age or older. The median age was 41 years. For every 100 females there were 95.50 males. For every 100 females age 18 and over, there were 91.80 males.
The median income for a household in the county was $38,345, and the median income for a family was $46,547. Males had a median income of $30,822 versus $23,003 for females. The per capita income for the county was $18,081. About 6.50% of families and 9.50% of the population were below the poverty line, including 11.40% of those under age 18 and 10.70% of those age 65 or over.
Communities
Other unincorporated places
Townships
Fremont County is divided into thirteen townships:
Population ranking
The population ranking of the following table is based on the 2020 census of Fremont County.[1]
† county seat
| Rank | City, town, etc. | Municipal type | Population (2020 Census) |
|---|---|---|---|
| 1 | † Sidney | City | 1,070 |
| 2 | Hamburg | City | 890 |
| 3 | Tabor (partially in Mills County) | City | 928 (1,014 total) |
| 4 | Farragut | City | 490 |
| 5 | Riverton | City | 245 |
| 6 | Randolph | City | 189 |
| 7 | Thurman | City | 167 |
| 8 | Percival | CDP | 53 |
| 9 | Imogene | City | 39 |
| 10 | Anderson | CDP | 37 |
| 11 | Bartlett | CDP | 5 |
| 12 | Shenandoah (mostly in Page County) | City | 0 (4,925 total) |
Politics
Prior to 1944, Fremont County was a swing county in presidential elections, voting for the national winner in every election from 1904 to 1940. Starting with the 1944 election, the county has become a Republican Party stronghold, only failing to back a Republican presidential candidate in 1964 amidst Lyndon B. Johnson's national landslide.
| Year | Republican | Democratic | Third Parties |
|---|---|---|---|
| 2020 | 70.3% 2,711 | 28.0% 1,080 | 1.7% 66 |
| 2016 | 67.0% 2,407 | 26.8% 963 | 6.3% 225 |
| 2012 | 53.8% 1,972 | 44.6% 1,637 | 1.6% 59 |
| 2008 | 51.1% 1,989 | 47.4% 1,848 | 1.5% 59 |
| 2004 | 60.4% 2,362 | 38.6% 1,510 | 1.0% 39 |
| 2000 | 57.2% 2,069 | 40.4% 1,459 | 2.4% 88 |
| 1996 | 44.2% 1,576 | 41.6% 1,481 | 14.2% 505 |
| 1992 | 37.3% 1,459 | 36.4% 1,422 | 26.3% 1,030 |
| 1988 | 55.2% 1,946 | 43.9% 1,547 | 1.0% 34 |
| 1984 | 64.8% 2,686 | 34.4% 1,426 | 0.8% 35 |
| 1980 | 65.2% 2,693 | 29.1% 1,203 | 5.7% 235 |
| 1976 | 51.8% 2,163 | 47.0% 1,964 | 1.2% 49 |
| 1972 | 67.6% 2,642 | 31.0% 1,210 | 1.4% 55 |
| 1968 | 55.9% 2,385 | 34.8% 1,484 | 9.4% 401 |
| 1964 | 42.9% 2,044 | 56.8% 2,703 | 0.3% 14 |
| 1960 | 56.7% 3,027 | 43.2% 2,307 | 0.0% 2 |
| 1956 | 58.8% 3,241 | 40.9% 2,254 | 0.3% 16 |
| 1952 | 64.5% 3,802 | 35.4% 2,085 | 0.1% 7 |
| 1948 | 50.2% 2,698 | 49.0% 2,637 | 0.8% 43 |
| 1944 | 53.0% 3,113 | 46.7% 2,747 | 0.3% 17 |
| 1940 | 49.3% 3,825 | 50.4% 3,914 | 0.3% 25 |
| 1936 | 43.2% 3,291 | 56.5% 4,301 | 0.3% 25 |
| 1932 | 33.5% 2,339 | 65.6% 4,585 | 0.9% 65 |
| 1928 | 55.7% 3,597 | 43.7% 2,822 | 0.6% 38 |
| 1924 | 53.2% 3,313 | 40.6% 2,525 | 6.2% 385 |
| 1920 | 59.3% 3,776 | 39.7% 2,524 | 1.0% 64 |
| 1916 | 44.4% 1,732 | 53.4% 2,085 | 2.2% 86 |
| 1912 | 26.3% 973 | 47.6% 1,762 | 26.1% 964 |
| 1908 | 48.6% 1,949 | 49.4% 1,979 | 2.0% 80 |
| 1904 | 56.9% 2,227 | 38.6% 1,511 | 4.4% 173 |
| 1900 | 46.6% 2,170 | 51.5% 2,399 | 1.9% 89 |
| 1896 | 40.2% 1,948 | 59.0% 2,857 | 0.8% 40 |
See also
References
- "2020 Census State Redistricting Data". census.gov. United states Census Bureau. Retrieved August 12, 2021.
- "Find a County". National Association of Counties. Archived from the original on May 31, 2011. Retrieved June 7, 2011.
- Gannett, Henry (1905). The Origin of Certain Place Names in the United States. Govt. Print. Off. p. 132.
- "US Gazetteer files: 2010, 2000, and 1990". United States Census Bureau. February 12, 2011. Retrieved April 23, 2011.
- Norvell, Kim (October 9, 2019). "205 days and counting: For western Iowa, recovery from historic flooding remains a long way off". Des Moines Register. Retrieved December 8, 2019.
- "U.S. Decennial Census". United States Census Bureau. Retrieved July 17, 2014.
- "Historical Census Browser". University of Virginia Library. Retrieved July 17, 2014.
- "Population of Counties by Decennial Census: 1900 to 1990". United States Census Bureau. Retrieved July 17, 2014.
- "Census 2000 PHC-T-4. Ranking Tables for Counties: 1990 and 2000" (PDF). United States Census Bureau. Retrieved July 17, 2014.
- "State & County QuickFacts". United States Census Bureau. Archived from the original on June 7, 2011. Retrieved July 17, 2014.
- "Population & Housing Occupancy Status 2010". United States Census Bureau American FactFinder. Retrieved May 11, 2011.
- "U.S. Census website". United States Census Bureau. Retrieved January 31, 2008.
- Leip, David. "Dave Leip's Atlas of U.S. Presidential Elections". uselectionatlas.org. Retrieved April 26, 2018.
External links
 |
Wikimedia Commons has media related to Fremont County, Iowa. |
Places adjacent to Fremont County, Iowa | ||||||||||||||||
|---|---|---|---|---|---|---|---|---|---|---|---|---|---|---|---|---|
| ||||||||||||||||


Municipalities and communities of Fremont County, Iowa, United States | ||
|---|---|---|
| Cities | Map of Iowa highlighting Fremont County | |
| Townships | ||
| CDPs | ||
| Other unincorporated community | ||
| Footnotes | ‡This populated place also has portions in an adjacent county or counties | |
| ||

Authority control  | |
|---|---|
| General | |
| National libraries | |
| Other | |