Kasibu
Kasibu, officially the Municipality of Kasibu (Gaddang: Ili na Kasibu; Ilocano: Ili ti Kasibu; Tagalog: Bayan ng Kasibu), is a 3rd class municipality in the province of Nueva Vizcaya, Philippines. According to the 2020 census, it has a population of 41,776 people. [3]
Kasibu | |
|---|---|
| Municipality of Kasibu | |
 Municipal hall | |
 Flag  Seal | |
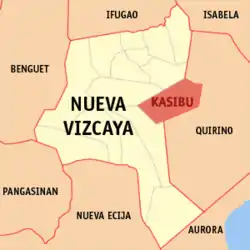 Map of Nueva Vizcaya with Kasibu highlighted | |
OpenStreetMap 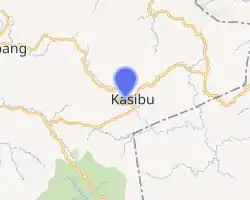
| |
.svg.png.webp)  Kasibu Location within the Philippines | |
| Coordinates: 16°19′N 121°17′E | |
| Country | Philippines |
| Region | Cagayan Valley |
| Province | Nueva Vizcaya |
| District | Lone district |
| Barangays | 30 (see Barangays) |
| Government | |
| • Type | Sangguniang Bayan |
| • Mayor | Romeo C. Tayaban |
| • Vice Mayor | Alberto D. Bumolo Jr. |
| • Representative | Luisa L. Cuaresma |
| • Electorate | 22,720 voters (2019) |
| Area | |
| • Total | 318.80 km2 (123.09 sq mi) |
| Elevation | 873 m (2,864 ft) |
| Highest elevation | 1,248 m (4,094 ft) |
| Lowest elevation | 678 m (2,224 ft) |
| Population | |
| • Total | 41,776 |
| • Density | 130/km2 (340/sq mi) |
| • Households | 8,415 |
| Economy | |
| • Income class | 3rd municipal income class |
| • Poverty incidence | 17.77% (2015)[4] |
| • Revenue | ₱237,054,507.62 (2020) |
| • Assets | ₱697,566,357.15 (2020) |
| • Expenditure | ₱210,772,680.31 (2020) |
| • Liabilities | ₱114,991,538.73 (2020) |
| Service provider | |
| • Electricity | Nueva Vizcaya Electric Cooperative (NUVELCO) |
| Time zone | UTC+8 (PST) |
| ZIP code | 3703 |
| PSGC | |
| IDD : area code | +63 (0)78 |
| Native languages | Ilocano Gaddang Bugkalot Tagalog |
Etymology
Kasibu comes from the Ilongot dialect, which denotes a venue where people settle their differences.
History
Long before the opening of the municipal district of Kasibu, there was a school and a constabulary detachment for the Ilongots, which necessitated the establishment of a kind of government to administer the place. For this reason, the provincial board during Governor Alfonso Castañeda's time requested the Governor-General to authorize the establishment of this place as a provisional municipal district to be supervised and administered by the provincial board through the office of the provincial governor.
By virtue of Executive Order No. 59, signed on 1 January 1926 by Governor General Leonard Wood, Kasibu was established as part of the Municipal District of Bambang. However, by virtue of a Proclamation issued by Governor Leon Cabarroguis in 1933, the Municipal District of Kasibu was reorganized as a Municipal District. On 9 November 1950, Executive Order No. 368,[5] signed by President Elpidio Quirino, abolished the municipal district structure in government and reattached Kasibu to Bambang. The very low population caused the abolition, as residents started to evacuate and abandon Kasibu due to the presence of dissidents from 1950 to 1955. On 9 January 1956, when peace and order was restored, President Ramon Magsaysay issued Executive Order No. 160[6] creating Kasibu as a separate municipality, but losing territorial jurisdiction over some of its barrios specifically Payupay, Belance, Oyao, Teguep, Manacgoc, Pangancan and Munguia, all on the eastern side in favor of Dupax del Norte.
Barangays
Kasibu is politically subdivided into 30 barangays.
- Antutot
- Alimit
- Poblacion (Alloy)
- Bilet
- Binogawan
- Bua
- Biyoy
- Capisaan
- Cordon
- Didipio
- Dine
- Kakiduguen
- Lupa
- Macalong
- Malabing
- Muta
- Pao
- Papaya
- Pudi
- Tokod
- Seguem
- Tadji
- Wangal
- Watwat
- Camamasi
- Catarawan
- Nantawacan
- Alloy
- Kongkong
- Pacquet (Ilongot Reservation)
Climate
| Climate data for Kasibu, Nueva Vizcaya | |||||||||||||
|---|---|---|---|---|---|---|---|---|---|---|---|---|---|
| Month | Jan | Feb | Mar | Apr | May | Jun | Jul | Aug | Sep | Oct | Nov | Dec | Year |
| Average high °C (°F) | 22 (72) |
23 (73) |
25 (77) |
28 (82) |
28 (82) |
27 (81) |
26 (79) |
26 (79) |
26 (79) |
26 (79) |
24 (75) |
22 (72) |
25 (78) |
| Average low °C (°F) | 16 (61) |
17 (63) |
18 (64) |
19 (66) |
21 (70) |
21 (70) |
21 (70) |
21 (70) |
20 (68) |
19 (66) |
18 (64) |
17 (63) |
19 (66) |
| Average precipitation mm (inches) | 89 (3.5) |
72 (2.8) |
54 (2.1) |
61 (2.4) |
202 (8.0) |
224 (8.8) |
263 (10.4) |
278 (10.9) |
270 (10.6) |
192 (7.6) |
129 (5.1) |
159 (6.3) |
1,993 (78.5) |
| Average rainy days | 17.8 | 14.5 | 13.5 | 14.1 | 22.9 | 25.6 | 27.4 | 26.2 | 25.3 | 20.4 | 17.9 | 20.3 | 245.9 |
| Source: Meteoblue [7] | |||||||||||||
Demographics
|
| |||||||||||||||||||||||||||||||||||||||||||||
| Source: Philippine Statistics Authority [8] [9] [10][11] | ||||||||||||||||||||||||||||||||||||||||||||||
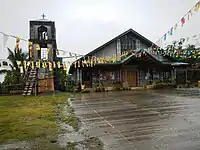
Gallery
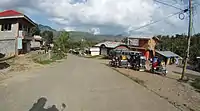

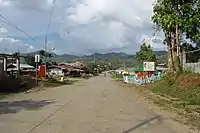
See also
References
- Municipality of Kasibu | (DILG)
- "2015 Census of Population, Report No. 3 – Population, Land Area, and Population Density" (PDF). Philippine Statistics Authority. Quezon City, Philippines. August 2016. ISSN 0117-1453. Archived (PDF) from the original on May 25, 2021. Retrieved July 16, 2021.
- Census of Population (2020). "Region II (Cagayan Valley)". Total Population by Province, City, Municipality and Barangay. PSA. Retrieved 8 July 2021.
- https://psa.gov.ph/sites/default/files/City%20and%20Municipal-level%20Small%20Area%20Poverty%20Estimates_%202009%2C%202012%20and%202015_0.xlsx; publication date: 10 July 2019; publisher: Philippine Statistics Authority.
- "Reorganizing the municipalities and municipal districts in the province of Nueva Vizcaya into ten municipalities, defining their boundaries, and abolishing the municipal districts". Official Gazette of the Republic of the Philippines. Retrieved 2021-01-12.
- "Recreating the Municipal District of Kasibu in the Province of Nueva Vizcaya". Official Gazette of the Republic of the Philippines. Retrieved 2021-01-12.
- "Kasibu: Average Temperatures and Rainfall". Meteoblue. Retrieved 4 July 2021.
- Census of Population (2015). "Region II (Cagayan Valley)". Total Population by Province, City, Municipality and Barangay. PSA. Retrieved 20 June 2016.
- Census of Population and Housing (2010). "Region II (Cagayan Valley)". Total Population by Province, City, Municipality and Barangay. NSO. Retrieved 29 June 2016.
- Censuses of Population (1903–2007). "Region II (Cagayan Valley)". Table 1. Population Enumerated in Various Censuses by Province/Highly Urbanized City: 1903 to 2007. NSO.
- "Province of Nueva Vizcaya". Municipality Population Data. Local Water Utilities Administration Research Division. Retrieved 17 December 2016.
- "Poverty incidence (PI):". Philippine Statistics Authority. Retrieved 28 December 2020.
- https://psa.gov.ph/sites/default/files/NSCB_LocalPovertyPhilippines_0.pdf; publication date: 29 November 2005; publisher: Philippine Statistics Authority.
- https://psa.gov.ph/sites/default/files/2003%20SAE%20of%20poverty%20%28Full%20Report%29_1.pdf; publication date: 23 March 2009; publisher: Philippine Statistics Authority.
- https://psa.gov.ph/sites/default/files/2006%20and%202009%20City%20and%20Municipal%20Level%20Poverty%20Estimates_0_1.pdf; publication date: 3 August 2012; publisher: Philippine Statistics Authority.
- https://psa.gov.ph/sites/default/files/2012%20Municipal%20and%20City%20Level%20Poverty%20Estima7tes%20Publication%20%281%29.pdf; publication date: 31 May 2016; publisher: Philippine Statistics Authority.
- https://psa.gov.ph/sites/default/files/City%20and%20Municipal-level%20Small%20Area%20Poverty%20Estimates_%202009%2C%202012%20and%202015_0.xlsx; publication date: 10 July 2019; publisher: Philippine Statistics Authority.
External links
 |
Wikimedia Commons has media related to Kasibu. |
- Kasibu Profile at PhilAtlas.com
- Philippine Standard Geographic Code
- Philippine Census Information
- Local Governance Performance Management System
Places adjacent to Kasibu | |
|---|---|


 Province of Nueva Vizcaya Province of Nueva Vizcaya | |
|---|---|
Bayombong (capital) | |
| Municipalities | |
| Barangays | |