Demographics of the Dominican Republic
This article is about the demographic features of the population of the Dominican Republic, including population density, ethnicity, education level, health of the populace, economic status, religious affiliations and other aspects of the population.
| Year | Pop. | ±% |
|---|---|---|
| 1920 | 894,665 | — |
| 1935 | 1,479,417 | +65.4% |
| 1950 | 2,135,872 | +44.4% |
| 1960 | 3,047,070 | +42.7% |
| 1970 | 4,009,458 | +31.6% |
| 1981 | 5,545,741 | +38.3% |
| 1993 | 7,293,390 | +31.5% |
| 2002 | 8,562,541 | +17.4% |
| 2010 | 9,445,281 | +10.3% |
| 2017 | 10,169,172 | +7.7% |
| Source:[1] | ||
Population
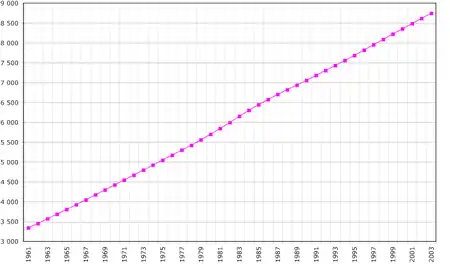
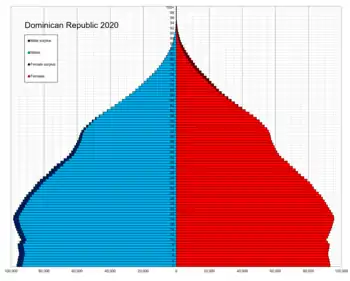
According to the 2019 revision of the World Population Prospects[2][3] the total population was 10,627,141 in 2018, compared to 2,380,000 in 1950. The proportion of the population aged below 15 in 2010 was 31.2%, 62.8% were aged between 15 and 65 years of age, while 6% were aged 65 years or older.[4]
| Total population (x 1000) |
Proportion aged 0–14 (%) |
Proportion aged 15–64 (%) |
Proportion aged 65+ (%) | |
|---|---|---|---|---|
| 1950 | 2 380 | 45.5 | 51.7 | 2.7 |
| 1955 | 2 796 | 46.3 | 51.1 | 2.6 |
| 1960 | 3 312 | 48.2 | 49.2 | 2.6 |
| 1965 | 3 900 | 48.9 | 48.5 | 2.6 |
| 1970 | 4 524 | 47.7 | 49.7 | 2.7 |
| 1975 | 5 169 | 45.3 | 51.9 | 2.8 |
| 1980 | 5 826 | 42.6 | 54.4 | 3.1 |
| 1985 | 6 524 | 40.4 | 56.2 | 3.4 |
| 1990 | 7 245 | 38.5 | 57.6 | 3.9 |
| 1995 | 7 978 | 37.0 | 58.5 | 4.5 |
| 2000 | 8 663 | 34.9 | 59.9 | 5.1 |
| 2005 | 9 343 | 33.1 | 61.3 | 5.7 |
| 2010 | 10 017 | 31.2 | 62.8 | 6.0 |
| 2015 | 10 528 | 30.0 | 63.4 | 6.7 |
| 2020 | 11 107 | 28.3 | 62.8 | 7.6 |
Vital statistics
UN estimates
Registration of vital events is not universal in the Dominican Republic. The Population Department of the United Nations prepared the following estimates: [4]
| Period | Live births per year |
Deaths per year |
Natural change per year |
CBR* | CDR* | NC* | TFR* | IMR* | Life expectancy total |
Life expectancy males |
Life expectancy females |
|---|---|---|---|---|---|---|---|---|---|---|---|
| 1950–1955 | 140 000 | 53 000 | 87 000 | 54.3 | 20.5 | 33.8 | 7.60 | 153 | 46.0 | 44.7 | 47.3 |
| 1955–1960 | 163 000 | 54 000 | 109 000 | 53.4 | 17.6 | 35.8 | 7.64 | 139 | 49.9 | 48.6 | 51.4 |
| 1960–1965 | 178 000 | 52 000 | 126 000 | 49.5 | 14.5 | 35.0 | 7.35 | 124 | 53.6 | 52.1 | 55.2 |
| 1965–1970 | 186 000 | 50 000 | 136 000 | 44.2 | 11.8 | 32.3 | 6.65 | 109 | 56.9 | 55.4 | 58.7 |
| 1970–1975 | 190 000 | 47 000 | 143 000 | 39.2 | 9.7 | 29.6 | 5.68 | 96 | 59.8 | 58.1 | 61.8 |
| 1975–1980 | 194 000 | 46 000 | 149 000 | 35.4 | 8.3 | 27.1 | 4.76 | 86 | 62.0 | 60.3 | 64.0 |
| 1980–1985 | 206 000 | 46 000 | 160 000 | 33.4 | 7.5 | 25.9 | 4.15 | 75 | 64.0 | 62.1 | 66.1 |
| 1985–1990 | 213 000 | 46 000 | 168 000 | 31.0 | 6.7 | 24.3 | 3.65 | 63 | 66.5 | 64.3 | 69.0 |
| 1990–1995 | 218 000 | 46 000 | 172 000 | 28.7 | 6.0 | 22.7 | 3.31 | 48 | 69.0 | 66.5 | 71.9 |
| 1995–2000 | 215 000 | 50 000 | 165 000 | 25.8 | 6.0 | 19.8 | 2.98 | 41 | 70.0 | 67.3 | 73.1 |
| 2000–2005 | 219 000 | 54 000 | 165 000 | 23.8 | 6.1 | 17.7 | 2.75 | 35 | 71.1 | 68.1 | 74.4 |
| 2005–2010 | 221 000 | 58 000 | 163 000 | 22.0 | 6.0 | 16.0 | 2.57 | 30 | 72.2 | 69.2 | 75.5 |
| 2010–2015 | 20.9 | 6.1 | 14.8 | 2.57 | |||||||
| 2015–2020 | 19.7 | 6.1 | 13.6 | 2.45 | |||||||
| 2020–2025 | 18.0 | 6.4 | 11.6 | 2.36 | |||||||
| 2025–2030 | 16.5 | 6.7 | 9.8 | 2.23 | |||||||
| 2030–2035 | 15.2 | 7.1 | 8.1 | 2.12 | |||||||
| 2035–2040 | 14.2 | 7.5 | 6.7 | 2.03 | |||||||
| * CBR = crude birth rate (per 1000); CDR = crude death rate (per 1000); NC = natural change (per 1000); IMR = infant mortality rate per 1000 births; TFR = total fertility rate (number of children per woman) | |||||||||||
Births and deaths
| Year | Population | Live births | Deaths | Natural increase | Crude birth rate | Crude death rate | Rate of natural increase | TFR |
|---|---|---|---|---|---|---|---|---|
| 2001 | 8,512,996 | 193,522 | 28,631 | 164,891 | 22.7 | 3.4 | 19.3 | 2.556 |
| 2002 | 8,627,509 | 189,813 | 26,603 | 163,210 | 22.0 | 3.1 | 18.9 | 2.475 |
| 2003 | 8,745,084 | 176,472 | 29,824 | 146,648 | 20.2 | 3.4 | 16.8 | 2.255 |
| 2004 | 8,857,648 | 167,533 | 34,507 | 133,026 | 18.9 | 3.9 | 15.0 | 2.128 |
| 2005 | 8,968,144 | 164,867 | 34,369 | 130,498 | 18.4 | 3.8 | 14.6 | 2.070 |
| 2006 | 9,071,458 | 156,849 | 32,385 | 124,464 | 17.3 | 3.6 | 13.7 | 1.959 |
| 2007 | 9,174,058 | 155,322 | 33,940 | 121,382 | 16.9 | 3.7 | 13.2 | 1.921 |
| 2008 | 9,279,602 | 162,173 | 34,012 | 128,161 | 17.5 | 3.7 | 13.8 | 2.000 |
| 2009 | 9,380,152 | 166,043 | 33,880 | 132,163 | 17.7 | 3.6 | 14.1 | 2.027 |
| 2010 | 9,478,612 | 167,964 | 36,607 | 131,357 | 17.7 | 3.9 | 13.8 | 2.026 |
| 2011 | 9,580,139 | 174,533 | 36,221 | 138,312 | 18.2 | 3.8 | 14.4 | 2.087 |
| 2012 | 9,680,963 | 168,061 | 36,447 | 131,614 | 17.4 | 3.8 | 13.6 | 1.999 |
| 2013 | 9,784,680 | 169,445 | 36,498 | 132,947 | 17.3 | 3.7 | 13.6 | 2.006 |
| 2014 | 9,883,486 | 172,786 | 41,123 | 131,663 | 17.5 | 4.2 | 13.3 | 2.030 |
| 2015 | 9,980,243 | 168,240 | 41,692 | 126,548 | 16.9 | 4.2 | 12.7 | 1.963 |
| 2016 | 10,075,045 | 159,161 | 43,971 | 115,190 | 15.8 | 4.4 | 11.4 | 1.845 |
| 2017 | 10,169,172 | 166,758 | 43,002 | 123,756 | 16.4 | 4.2 | 12.2 | 1.930 |
| 2018 | 10,266,149 | 172,723 | 42,199 | 130,524 | 16.8 | 4.1 | 12.7 | 2.000 |
| 2019 | 10,358,320 | 175,466 | 44,024 | 131,442 | 16.9 | 4.3 | 12.6 | 2.027 |
| 2020 | 10,448,499 | 141,548 | 42,789 | 98,759 | 13.5 | 4.1 | 9.4 | 1.645 |
Structure of the population [6]
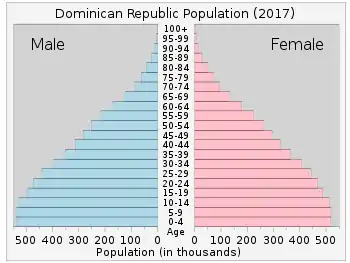
Structure of the population (01.07.2017) (Estimates) :
| Age Group | Male | Female | Total | % |
|---|---|---|---|---|
| Total | 5 082 876 | 5 086 296 | 10 169 172 | 100 |
| 0–4 | 492 808 | 472 820 | 965 628 | 9,49 |
| 5–9 | 492 702 | 474 348 | 967 050 | 9,50 |
| 10–14 | 492 107 | 477 445 | 969 552 | 9,53 |
| 15–19 | 480 035 | 471 501 | 951 536 | 9,51 |
| 20–24 | 455 440 | 453 444 | 930 505 | 9,15 |
| 25–29 | 420 715 | 423 382 | 844 907 | 8,30 |
| 30–34 | 377 850 | 385 180 | 763 030 | 7,50 |
| 35–39 | 339 877 | 348 143 | 688 020 | 6,76 |
| 40–44 | 306 907 | 313 858 | 616 955 | 6,07 |
| 45–49 | 275 488 | 282 105 | 557 593 | 5,48 |
| 50–54 | 245 299 | 249 766 | 495 065 | 4,87 |
| 55–59 | 206 257 | 210 188 | 416 445 | 4,10 |
| 60–64 | 162 912 | 168 103 | 331 015 | 3,25 |
| 65–69 | 121 894 | 126 929 | 248 523 | 2,44 |
| 70–74 | 86 739 | 90 761 | 177 500 | 1,74 |
| 75–79 | 61 133 | 65 274 | 126 407 | 1,24 |
| 80+ | 65 523 | 73 349 | 138 872 | 1,36 |
| Age group | Male | Female | Total | Percent |
|---|---|---|---|---|
| 0–14 | 1 595 851 | 1 538 432 | 3 134 283 | 30,56 |
| 15–64 | 3 213 973 | 3 268 108 | 6 482 081 | 63,19 |
| 65+ | 306 501 | 334 859 | 641 360 | 6,25 |
Structure of the population (DHS 2013) (Males 19 686, Females 19 878 = 39 564) :
| Age Group | Male (%) | Female (%) | Total (%) |
|---|---|---|---|
| 0–4 | 10,2 | 9,6 | 9,9 |
| 5–9 | 9,6 | 9,1 | 9,4 |
| 10–14 | 10,5 | 10,7 | 10,6 |
| 15–19 | 10,0 | 9,8 | 9,9 |
| 20–24 | 9,6 | 9,1 | 9,3 |
| 25–29 | 7,9 | 7,8 | 7,9 |
| 30–34 | 7,7 | 7,6 | 7,6 |
| 35–39 | 6,4 | 6,2 | 6,3 |
| 40–44 | 6,2 | 5,9 | 6,0 |
| 45–49 | 5,2 | 5,4 | 5,3 |
| 50–54 | 4,1 | 5,2 | 4,7 |
| 55–59 | 3,3 | 3,5 | 3,4 |
| 60–64 | 3,0 | 3,5 | 3,2 |
| 65–69 | 1,9 | 2,0 | 2,0 |
| 70–74 | 1,7 | 1,7 | 1,7 |
| 75–79 | 1,2 | 1,1 | 1,1 |
| 80+ | 1,7 | 1,8 | 1,8 |
| Age group | Male (%) | Female (%) | Total (%) |
|---|---|---|---|
| 0–14 | 30,3 | 29,4 | 29,9 |
| 15–64 | 63,2 | 64,0 | 63,5 |
| 65+ | 6,5 | 6,6 | 6,6 |
Fertility and births
Total Fertility Rate (TFR) (Wanted Fertility Rate) and Crude Birth Rate (CBR):[7]
| Year | CBR (Total) | TFR (Total) | CBR (Urban) | TFR (Urban) | CBR (Rural) | TFR (Rural) |
|---|---|---|---|---|---|---|
| 1965–69 | 7,1 | |||||
| 1970–74 | 5,8 | |||||
| 1975–79 | 4,7 | |||||
| 1980–82 | 4,31 | |||||
| 1983–85 | 3,69 | |||||
| 1986 | 3,8 (2,8) | 3,2 (2,5) | 5,1 (3,5) | |||
| 1991 | 30,1 | 3,3 (2,6) | 29,7 | 2,8 (2,3) | 30,5 | 4,4 (3,1) |
| 1996 | 27,7 | 3,2 (2,5) | 24,4 | 2,8 (2,2) | 29,8 | 4,0 (3,0) |
| 1999 | 2,9 (2,3) | 2,7 (2,1) | 3,4 (2,7) | |||
| 2002 | 25,2 | 3,0 (2,3) | 25,3 | 2,8 (2,3) | 24,9 | 3,3 (2,5) |
| 2007 | 20,4 | 2,4 (1,9) | 20,0 | 2,3 (1,8) | 21,4 | 2,8 (2,1) |
| 2013 | 20,9 | 2,5 (2,0) | 21,2 | 2,4 (1,9) | 20,3 | 2,6 (2,1) |
Other demographic statistics
Demographic statistics according to the World Population Review in 2019.[8]
- One birth every 2 minutes
- One death every 8 minutes
- One net migrant every 18 minutes
- Net gain of one person every 5 minutes
Demographic statistics according to the CIA World Factbook, unless otherwise indicated.[9]
- Population
- 10,298,756 (July 2018 est.)
- Age structure
- 0-14 years: 27.56% (male 1,442,926 /female 1,395,809)
- 15-24 years: 18.52% (male 969,467 /female 937,765)
- 25-54 years: 40.28% (male 2,112,813 /female 2,035,902)
- 55-64 years: 7.71% (male 397,821 /female 396,172)
- 65 years and over: 5.92% (male 286,300 /female 323,781) (2018 est.)
- Ethnic groups
- mixed 70.4% (mestizo 58%, mulatto 12.4%), black 15.8%, white 13.5%, other 0.3% (2014 est.)
- note: respondents self-identified their race; the term "indio" in the Dominican Republic is not associated with people of indigenous ancestry but people of mixed ancestry or skin color between light and dark
- Median age
- total: 27.3 years. Country comparison to the world: 145th
- male: 27.1 years
- female: 27.4 years (2018 est.)
- Birth rate
- 18.9 births/1,000 population (2018 est.) Country comparison to the world: 84th
- Death rate
- 6.4 deaths/1,000 population (2018 est.) Country comparison to the world: 145th
- Total fertility rate
- 2.28 children born/woman (2018 est.) Country comparison to the world: 88th
- Net migration rate
- -2.6 migrant(s)/1,000 population (2018 est.) Country comparison to the world: 170th
- Population growth rate
- 0.99% (2018 est.) Country comparison to the world: 109th
- Mother's mean age at first birth
- 21.3 years (2013 est.)
- note: median age at first birth among women 25-29
- Contraceptive prevalence rate
- 69.5% (2014)
- Dependency ratios
- total dependency ratio: 57.8 (2015 est.) Country comparison to the world: 151st
- youth dependency ratio: 47.3 (2015 est.)
- elderly dependency ratio: 10.5 (2015 est.)
- potential support ratio: 9.5 (2015 est.)
- Life expectancy at birth
- total population: 71.3 years. Country comparison to the world: 151st
- male: 69.7 years
- female: 73.1 years (2018 est.)
- Religions
- Roman Catholic 95%
- Other 5%
- Urbanization
- urban population: 81.1% of total population (2018)
- rate of urbanization: 2.06% annual rate of change (2015-20 est.)
- Languages
- Spanish (official)
- Literacy
definition: age 15 and over can read and write (2016 est.)
- total population: 93.8%
- male: 93.8%
- female: 93.8% (2016 est.)
- School life expectancy (primary to tertiary education)
- total: 14 years
- male: 13 years
- female: 14 years (2016)
Unemployment, youth ages 15–24:
- total: 13.4%. Country comparison to the world: 97th
- male: 8.5%
- female: 21.7% (2016 est.)
See also
- Census information:
References
- "Censos de Población y Vivienda". Oficina Nacional de Estadística. Archived from the original on 29 June 2017. Retrieved 26 June 2017.
- ""World Population prospects – Population division"". population.un.org. United Nations Department of Economic and Social Affairs, Population Division. Retrieved November 9, 2019.
- ""Overall total population" – World Population Prospects: The 2019 Revision" (xslx). population.un.org (custom data acquired via website). United Nations Department of Economic and Social Affairs, Population Division. Retrieved November 9, 2019.
- "World Population Prospects - Population Division - United Nations". population.un.org. Archived from the original on May 6, 2011.
- "Archived copy". Archived from the original on 2015-11-14. Retrieved 2016-02-07.CS1 maint: archived copy as title (link)
- https://unstats.un.org/unsd/demographic-social/products/dyb/documents/dyb2017/table07.pdf
- "MEASURE DHS: Demographic and Health Surveys". microdata.worldbank.org.
- "Dominican Republic Population 2019", World Population Review
- "World Factbook CENTRAL AMERICA : DOMINICAN REPUBLIC", The World Factbook, July 12, 2018
 This article incorporates text from this source, which is in the public domain.