Mutia, Zamboanga del Norte
Mutia, officially the Municipality of Mutia (Cebuano: Lungsod sa Mutia; Subanen: Benwa Mutia; Chavacano: Municipalidad de Mutia; Tagalog: Bayan ng Mutia), is a 5th class municipality in the province of Zamboanga del Norte, Philippines. According to the 2020 census, it has a population of 11,726 people. [3]
Mutia | |
|---|---|
| Municipality of Mutia | |
 Seal | |
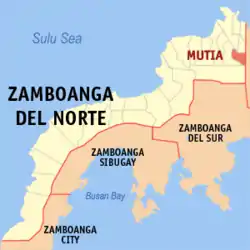 Map of Zamboanga del Norte with Mutia highlighted | |
OpenStreetMap 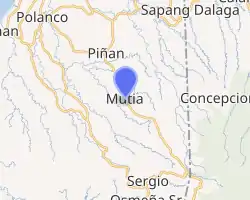
| |
.svg.png.webp)  Mutia Location within the Philippines | |
| Coordinates: 8°25′03″N 123°28′38″E | |
| Country | Philippines |
| Region | Zamboanga Peninsula |
| Province | Zamboanga del Norte |
| District | 1st district |
| Barangays | 16 (see Barangays) |
| Government | |
| • Type | Sangguniang Bayan |
| • Mayor | Lorrymir S. Adasa |
| • Vice Mayor | Arthur C. Tenorio |
| • Representative | Romeo M. Jalosjos Jr. |
| • Municipal Council | Members |
| • Electorate | 8,712 voters (2019) |
| Area | |
| • Total | 73.58 km2 (28.41 sq mi) |
| Elevation | 191 m (627 ft) |
| Highest elevation | 509 m (1,670 ft) |
| Lowest elevation | 38 m (125 ft) |
| Population | |
| • Total | 11,726 |
| • Density | 160/km2 (410/sq mi) |
| • Households | 2,683 |
| Economy | |
| • Income class | 5th municipal income class |
| • Poverty incidence | 49.99% (2015)[4] |
| • Revenue | ₱102,785,000.00 (2020) |
| • Assets | ₱295,953,000.00 (2020) |
| • Expenditure | ₱84,655,000.00 (2020) |
| • Liabilities | ₱82,643,000.00 (2020) |
| Service provider | |
| • Electricity | Zamboanga del Norte Electric Cooperative (ZANECO) |
| Time zone | UTC+8 (PST) |
| ZIP code | 7107 |
| PSGC | |
| IDD : area code | +63 (0)65 |
| Native languages | Subanon Cebuano Chavacano Tagalog |
| Website | mutia |
Barangays
Mutia is politically subdivided into 16 barangays.
- Alvenda
- Buenasuerte
- Diland
- Diolen
- Head Tipan
- New Casul
- New Siquijor
- Newland
- Paso Rio
- Poblacion
- San Miguel
- Santo Tomas
- Tinglan
- Totongon
- Tubac
- Unidos
Climate
| Climate data for Mutia, Zamboanga del Norte | |||||||||||||
|---|---|---|---|---|---|---|---|---|---|---|---|---|---|
| Month | Jan | Feb | Mar | Apr | May | Jun | Jul | Aug | Sep | Oct | Nov | Dec | Year |
| Average high °C (°F) | 28 (82) |
28 (82) |
29 (84) |
30 (86) |
29 (84) |
29 (84) |
29 (84) |
29 (84) |
29 (84) |
28 (82) |
29 (84) |
28 (82) |
29 (84) |
| Average low °C (°F) | 22 (72) |
22 (72) |
22 (72) |
23 (73) |
24 (75) |
24 (75) |
24 (75) |
23 (73) |
23 (73) |
23 (73) |
23 (73) |
23 (73) |
23 (73) |
| Average precipitation mm (inches) | 104 (4.1) |
76 (3.0) |
92 (3.6) |
97 (3.8) |
199 (7.8) |
238 (9.4) |
195 (7.7) |
193 (7.6) |
178 (7.0) |
212 (8.3) |
171 (6.7) |
110 (4.3) |
1,865 (73.3) |
| Average rainy days | 14.7 | 12.5 | 15.8 | 17.5 | 27.6 | 28.5 | 29.0 | 27.5 | 26.9 | 27.9 | 23.5 | 18.2 | 269.6 |
| Source: Meteoblue [5] | |||||||||||||
Demographics
| Year | Pop. | ±% p.a. |
|---|---|---|
| 1970 | 6,093 | — |
| 1975 | 6,895 | +2.51% |
| 1980 | 7,976 | +2.95% |
| 1990 | 8,625 | +0.79% |
| 1995 | 8,915 | +0.62% |
| 2000 | 9,806 | +2.06% |
| 2007 | 12,078 | +2.92% |
| 2010 | 11,975 | −0.31% |
| 2015 | 12,675 | +1.09% |
| 2020 | 11,726 | −1.52% |
| Source: Philippine Statistics Authority [6] [7] [8][9] | ||
References
- Municipality of Mutia | (DILG)
- "2015 Census of Population, Report No. 3 – Population, Land Area, and Population Density" (PDF). Philippine Statistics Authority. Quezon City, Philippines. August 2016. ISSN 0117-1453. Archived (PDF) from the original on May 25, 2021. Retrieved July 16, 2021.
- Census of Population (2020). "Region IX (Zamboanga Peninsula)". Total Population by Province, City, Municipality and Barangay. PSA. Retrieved 8 July 2021.
- https://psa.gov.ph/sites/default/files/City%20and%20Municipal-level%20Small%20Area%20Poverty%20Estimates_%202009%2C%202012%20and%202015_0.xlsx; publication date: 10 July 2019; publisher: Philippine Statistics Authority.
- "Mutia: Average Temperatures and Rainfall". Meteoblue. Retrieved 30 April 2020.
- Census of Population (2015). "Region IX (Zamboanga Peninsula)". Total Population by Province, City, Municipality and Barangay. PSA. Retrieved 20 June 2016.
- Census of Population and Housing (2010). "Region IX (Zamboanga Peninsula)". Total Population by Province, City, Municipality and Barangay. NSO. Retrieved 29 June 2016.
- Censuses of Population (1903–2007). "Region IX (Zamboanga Peninsula)". Table 1. Population Enumerated in Various Censuses by Province/Highly Urbanized City: 1903 to 2007. NSO.
- "Province of Zamboanga del Norte". Municipality Population Data. Local Water Utilities Administration Research Division. Retrieved 17 December 2016.
- "Poverty incidence (PI):". Philippine Statistics Authority. Retrieved 28 December 2020.
- https://psa.gov.ph/sites/default/files/NSCB_LocalPovertyPhilippines_0.pdf; publication date: 29 November 2005; publisher: Philippine Statistics Authority.
- https://psa.gov.ph/sites/default/files/2003%20SAE%20of%20poverty%20%28Full%20Report%29_1.pdf; publication date: 23 March 2009; publisher: Philippine Statistics Authority.
- https://psa.gov.ph/sites/default/files/2006%20and%202009%20City%20and%20Municipal%20Level%20Poverty%20Estimates_0_1.pdf; publication date: 3 August 2012; publisher: Philippine Statistics Authority.
- https://psa.gov.ph/sites/default/files/2012%20Municipal%20and%20City%20Level%20Poverty%20Estima7tes%20Publication%20%281%29.pdf; publication date: 31 May 2016; publisher: Philippine Statistics Authority.
- https://psa.gov.ph/sites/default/files/City%20and%20Municipal-level%20Small%20Area%20Poverty%20Estimates_%202009%2C%202012%20and%202015_0.xlsx; publication date: 10 July 2019; publisher: Philippine Statistics Authority.
External links
Places adjacent to Mutia, Zamboanga del Norte | |
|---|---|


 Province of Zamboanga del Norte Province of Zamboanga del Norte | |
|---|---|
Dipolog (capital) | |
| Municipalities | |
| Component cities | |
| Islands |
|
This article is issued from Wikipedia. The text is licensed under Creative Commons - Attribution - Sharealike. Additional terms may apply for the media files.