Net international investment position
The net international investment position (NIIP) is the difference between the external financial assets and liabilities of a country.[1] External debt of a country includes government debt and private debt. External assets publicly and privately held by a country's legal residents are also taken into account when calculating NIIP.[2] Commodities and currencies tend to follow a cyclical pattern of significant valuation changes, which is also reflected in NIIP.
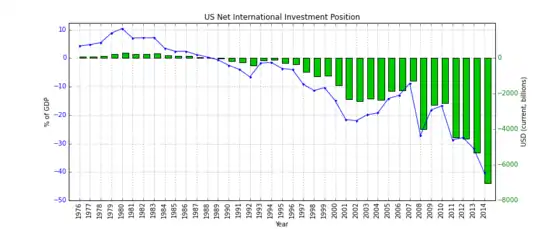
The International investment position (IIP) of a country is a financial statement of the value and composition of its external financial assets and liabilities. A positive NIIP value indicates that a nation is a creditor nation, while a negative value indicates that it is a debtor nation.
History
The US was the world's largest creditor until the 1960s. However, over the last few decades, the US has become the world's largest debtor. Since the 1980s, Japan replaced the USA as the world's largest creditor nation. With the ascent of the Hong Kong Monetary Authority's credit position since 2015, China (including Hong Kong and Macau) and Japan have been competing for the top creditor position.
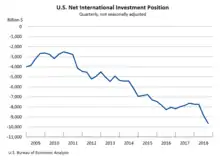
List of countries and regions by net international investment position
| Countries and regions | Date | GDP[3]
(US$MM) |
Date | NIIP[4]
(US$MM) |
Date | NIIP
(%GDP) |
|---|---|---|---|---|---|---|
 Albania Albania | 2021 | 17,138 | 2021Q1 | -9,028 | 2019 | −52.1 |
 Argentina Argentina | 2021 | 418,150 | 2021Q1 | +128,627 | 2019 | 26.3 |
 Armenia Armenia | 2021 | 12,251 | 2021Q1 | -10,124 | 2019 | −73.1 |
.svg.png.webp) Australia Australia | 2021 | 1,617,543 | 2021Q1 | -664,900 | 2021 | −41.1 |
 Austria Austria | 2021 | 481,796 | 2021Q1 | +58,662 | 2021Q1 | 13.4[5] |
 Bangladesh Bangladesh | 2021 | 352,908 | 2021Q1 | -44,673 | 2019 | −13.5 |
 Belarus Belarus | 2021 | 60,725 | 2021Q1 | -31,417 | 2021 | −51.7 |
.svg.png.webp) Belgium Belgium | 2021 | 578,996 | 2021Q1 | +263,132 | 2021Q1 | 49.5[5] |
 Bhutan Bhutan | 2021 | 2,480 | 2021Q1 | -2,585 | 2021 | −104.2 |
 Brazil Brazil | 2021 | 1,491,772 | 2021Q1 | -460,181 | 2019 | −39.6 |
 Bulgaria Bulgaria | 2021 | 77,782 | 2021Q1 | -17,228 | 2021Q1 | −24.0[5] |
 Cambodia Cambodia | 2021 | 27,239 | 2021Q1 | -25,658 | 2021 | −94.2 |
.svg.png.webp) Canada Canada | 2021 | 1,883,487 | 2021Q1 | +1,105,744 | 2021 | 58.7 |
 Chile Chile | 2021 | 307,938 | 2021Q1 | -28,989 | 2021 | −9.4 |
 Democratic Republic of the Congo Democratic Republic of the Congo | 2021 | 55,088 | 2018 | -19,779 | 2018 | −42.0 |
 Colombia Colombia | 2021 | 295,610 | 2021Q1 | -171,915 | 2019 | −51.7 |
 People's Republic of China People's Republic of China | 2021 | 16,642,318 | 2021Q1 | +2,140,041 | 2021 | 12.9 |
 Croatia Croatia | 2021 | 65,217 | 2020 | -31,558 | 2021Q1 | −50.0[5] |
 Cyprus Cyprus | 2021 | 26,479 | 2021Q1 | -35,545 | 2021Q1 | −145.6[5] |
 Czech Republic Czech Republic | 2021 | 276,109 | 2021Q1 | -24,507 | 2021Q1 | −9.6[5] |
 Denmark Denmark | 2021 | 392,570 | 2021Q1 | +278,307 | 2021Q1 | 76.3[5] |
 Egypt Egypt | 2021 | 394,284 | 2021Q1 | -209,599 | 2021 | −53.2 |
 Estonia Estonia | 2021 | 35,187 | 2021Q1 | -6,872 | 2021Q1 | −21.3[5] |
 Finland Finland | 2021 | 300,484 | 2021Q1 | +24,303 | 2021Q1 | 8.7[5] |
 France France | 2021 | 2,938,271 | 2021Q1 | -889,171 | 2021Q1 | −32.7[5] |
 Germany Germany | 2021 | 4,319,286 | 2021Q1 | +3,055,922 | 2021Q1 | 78.4[5] |
 Greece Greece | 2021 | 209,857 | 2021Q1 | -352,272 | 2021Q1 | −182.7[5] |
 Hong Kong Hong Kong | 2021 | 368,633 | 2021Q1 | +2,163,155 | 2021 | 586.8 |
 Hungary Hungary | 2021 | 176,543 | 2021Q1 | -74,450 | 2021Q1 | −47.8[5] |
 Iceland Iceland | 2021 | 24,155 | 2021Q1 | +8,466 | 2019(Q1) | 21[6] |
 India India | 2021 | 3,049,704 | 2021 | -379,300 | March 2020 | −14[7] |
 Indonesia Indonesia | 2021 | 1,158,783 | 2021Q1 | -268,597 | 2019 | −30.4 |
 Ireland Ireland | 2021 | 476,663 | 2020Q3 | -705,962 | 2021Q1 | −168.7[5] |
 Israel Israel | 2021 | 446,708 | 2021Q1 | +190,555 | 2021 | 42.7 |
 Italy Italy | 2021 | 2,106,287 | 2021Q1 | +40,176 | 2021Q1 | 2.1[5] |
 Japan Japan | 2021 | 5,378,136 | 2021Q1 | +3,375,849 | 2021 | 62.8 |
 Kazakhstan Kazakhstan | 2021 | 187,836 | 2021Q1 | -74,204 | 2019 | −36.2 |
 Kuwait Kuwait | 2021 | 126,930 | 2020 | +89,847 | 2019 | 69.7 |
 Latvia Latvia | 2021 | 37,720 | 2021Q1 | -11,806 | 2021Q1 | −34.2[5] |
 Lithuania Lithuania | 2021 | 62,198 | 2021Q1 | -7,821 | 2021Q1 | −13.5[5] |
 Luxembourg Luxembourg | 2021 | 84,077 | 2021Q1 | +40,328 | 2021Q1 | 52.5[5] |
 Malaysia Malaysia | 2021 | 387,093 | 2021Q1 | +25,589 | 2020 | 5.9 |
 Malta Malta | 2021 | 16,476 | 2020Q3 | +9,100 | 2021Q1 | 60.9[5] |
 Mexico Mexico | 2021 | 1,192,480 | 2021Q1 | -586,528 | 2019 | −51.4 |
 Mongolia Mongolia | 2021 | 14,233 | 2021Q1 | -37,419 | 2021 | −262.9 |
 Montenegro Montenegro | 2021 | 5,651 | 2018 | -9,044 | 2018 | −178.8 |
 Mozambique Mozambique | 2021 | 13,957 | 2021Q1 | -59,996 | 2021 | −429.9 |
 Netherlands Netherlands | 2021 | 1,012,598 | 2021Q1 | +959,049 | 2021Q1 | 102.3[5] |
 New Zealand New Zealand | 2021 | 243,332 | 2021Q1 | -112,488 | 2019 | −46.2 |
 Nicaragua Nicaragua | 2021 | 12,283 | 2020 | -14,456 | 2019 | −119.9 |
 Nigeria Nigeria | 2021 | 514,049 | 2020 | -85,211 | 2019 | −16.3 |
 Norway Norway | 2021 | 444,519 | 2021Q1 | +1,175,781 | 2021 | 264.5 |
 Pakistan Pakistan | 2021 | 262,799 | 2021Q1 | -116,935 | 2021 | −44.5 |
 Panama Panama | 2021 | 59,377 | 2020 | -64,857 | 2020 | −122.5 |
 Peru Peru | 2021 | 225,918 | 2020Q2 | -86,078 | 2018 | −37.4 |
 Philippines Philippines | 2021 | 402,638 | 2021Q1 | -15,322 | 2020 | −5.6 |
 Poland Poland | 2021 | 642,121 | 2021Q1 | -254,623 | 2021Q1 | −43.0[5] |
 Portugal Portugal | 2021 | 257,391 | 2021Q1 | -246,961 | 2021Q1 | −104.9[5] |
 Romania Romania | 2021 | 289,130 | 2021Q1 | -121,438 | 2021Q1 | −48.0[5] |
 Russia Russia | 2021 | 1,710,734 | 2021Q1 | +458,533 | 2021 | 26.8 |
 Saudi Arabia Saudi Arabia | 2021 | 804,921 | 2021Q1 | +587,883 | 2021 | 73.0 |
 Serbia Serbia | 2021 | 60,435 | 2021Q1 | -49,970 | 2019 | −88.5 |
 Singapore Singapore | 2021 | 374,934 | 2021Q1 | +1,035,082 | 2021 | 276.1 |
 Slovakia Slovakia | 2021 | 117,664 | 2021Q1 | -67,785 | 2021Q1 | −63.0[5] |
 Slovenia Slovenia | 2021 | 59,132 | 2021Q1 | -4,876 | 2021Q1 | −12.5[5] |
 South Africa South Africa | 2021 | 329,529 | 2021Q1 | +97,342 | 2021 | 29.5 |
 South Korea South Korea | 2021 | 1,806,707 | 2021Q1 | +477,517 | 2021 | 26.4 |
 Spain Spain | 2021 | 1,461,552 | 2021Q1 | -1,096,594 | 2021Q1 | −84.1[5] |
 Sudan Sudan | 2021 | 35,827 | 2018 | -85,180 | 2018 | −248.5 |
 Sweden Sweden | 2021 | 625,948 | 2021Q1 | +116,427 | 2021Q1 | 20.3[5] |
 Switzerland Switzerland | 2021 | 824,734 | 2021Q1 | +808,373 | 2021 | 98.0 |
 Taiwan Taiwan | 2021 | 759,104 | 2020 | +1,371,420[8] | 2020 | 205.1 |
 Thailand Thailand | 2021 | 538,735 | 2021Q1 | +36,251 | 2019 | 11.0 |
 Tunisia Tunisia | 2021 | 44,265 | 2019 | -63,678 | 2019 | −162.6 |
 Turkey Turkey | 2021 | 794,530 | 2021Q2 | -280,624 | 2021 | −35.3 |
 Uganda Uganda | 2021 | 41,271 | 2019 | -18,640 | 2019 | −60.8 |
 Ukraine Ukraine | 2021 | 164,593 | 2021Q1 | -21,613 | 2021 | −13.1 |
 United Kingdom United Kingdom | 2021 | 3,124,650 | 2021Q1 | -802,202 | 2021 | −25.7 |
 United States United States | 2021 | 22,675,271 | 2021Q1 | -14,320,275 | 2021Q1 | −64.9 |
 Uzbekistan Uzbekistan | 2021 | 61,203 | 2021Q1 | +18,494 | 2021 | 30.2 |
 Zambia Zambia | 2021 | 18,955 | 2020Q3 | -28,177 | 2019 | −116.5 |
See also
References
- Bivens, L. Josh (December 14, 2004). "Debt and the dollar: The United States damages future living standards by borrowing itself into a deceptively deep hole". Epinet.org. Archived from the original on January 20, 2008. Retrieved 2009-06-28.
- Ministry of Economic and Finance of Argentina International Investment Position Methodology page.1
- "Report for Selected Country Groups and Subjects". International Monetary Fund.
- "IMF Data". data.imf.org. Retrieved 30 May 2021.
- . Eurostat https://ec.europa.eu/eurostat/databrowser/view/tipsii40/default/table?lang=en. Retrieved 20 April 2021. Missing or empty
|title=(help) - Central Bank of Iceland
- "India's International Investment Position (IIP), March 2020". Reserve Bank of India. Retrieved 2021-01-30.
- Central Bank of the Republic of China (Taiwan)
External links
- Bureau of Economic Analysis Elena L. Nguyen: The International Investment Position of the United States at Yearend 2007. U.S.
- Bank of Japan Japan’s International Investment Position at Year-End 2009 (Retrieved on June 30, 2011)
- Deutsche Bundesbank (German Central Bank) International Investment Position - External Debt Statistics
- European Economic Forecast Spring 2010 European Commission working draft Graph 1.3.2., International investment position since 1980 in major economic units.
Statistics
- International Monetary Fund (IMF) International Investment Position (IIP) Data
- International Monetary Fund (IMF) World Economic Outlook Database, April 2011
- UK National Statistics Great Britain: International Investment Position, Table K
- Saint-Petersburg (Russia) statistic Economic statistics of St. Petersburg
Authority control  | |
|---|---|
| General | |
| Other | |