Roberts County, Texas
Roberts County is a county located in the U.S. state of Texas. As of the 2010 census, its population was 929,[1] making it the seventh-least populous county in Texas. Its county seat is Miami, which is also the county's only incorporated community.[2] The county was created in 1876 and organized in 1889.[3] It is named for Oran Milo Roberts, a governor of Texas. Roberts County is one of six[4] prohibition, or entirely dry, counties in the state of Texas. Today, it is best known for being the most Republican county nationwide in the two latest presidential elections.
Roberts County | |
|---|---|
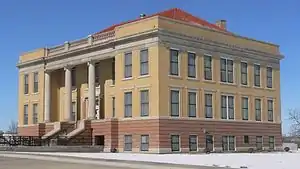 Roberts County courthouse in Miami | |
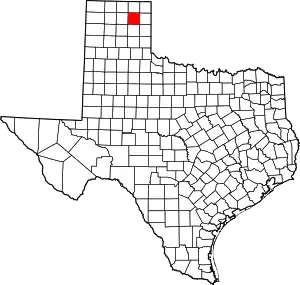 Location within the U.S. state of Texas | |
 Texas's location within the U.S. | |
| Coordinates: 35°50′N 100°49′W | |
| Country |  United States United States |
| State |  Texas Texas |
| Founded | 1889 |
| Named for | Oran Milo Roberts |
| Seat | Miami |
| Largest city | Miami |
| Area | |
| • Total | 924 sq mi (2,390 km2) |
| • Land | 924 sq mi (2,390 km2) |
| • Water | 0.1 sq mi (0.3 km2) 0.01%% |
| Population | |
| • Estimate (2017) | 938 |
| • Density | 1/sq mi (0.4/km2) |
| Time zone | UTC−6 (Central) |
| • Summer (DST) | UTC−5 (CDT) |
| Congressional district | 13th |
| Website | www |
History
The Plains Apache inhabited the Texas Panhandle until they were displaced by the Comanche who dominated the area until the 1870s. The Comanche hunted the large herds of buffalo, which grazed on the prairie. In the Red River War of 1874–75, United States Army troops led by Ranald S. Mackenzie drove out the Comanches. Simultaneously, buffalo hunters killed the large herds in the area, destroying the food supply and livelihood of the Plains tribes, making way for permanent settlement by Anglo-Americans.
In 1876, Roberts County was carved from Bexar County and the Clay Land District.[5] In 1887, the Southern Kansas Railway was built through Roberts County, and settlers followed.
Roberts County is the scene of a recent battle for water rights, where the City of Amarillo, Texas, the Canadian River Municipal Water Authority, and T. Boone Pickens have sought to purchase the water rights within the county. Between the three, they own 80% of the water rights.[6]
Geography
According to the U.S. Census Bureau, the county has a total area of 924 sq mi (2,390 km2), of which 0.1 sq mi (0.26 km2) (0.01%) is covered by water.[7]
The county is relatively flat except for the Canadian River valley. Most of the land is used for cattle ranching. The county contains the 68,000-acre (280 km2) Mesa Vista Ranch, which seeks to protect quail, dove, and pheasant habitat along the creek beds south of the Canadian River.[8]
Major highways


Adjacent counties
- Ochiltree County (north)
- Lipscomb County northeast)
- Hemphill County (east)
- Gray County (south)
- Carson County (southwest)
- Hutchinson County (west)
- Hansford County (northwest)
- Wheeler County (southeast)
Demographics
| Historical population | |||
|---|---|---|---|
| Census | Pop. | %± | |
| 1880 | 32 | — | |
| 1890 | 326 | 918.8% | |
| 1900 | 620 | 90.2% | |
| 1910 | 950 | 53.2% | |
| 1920 | 1,469 | 54.6% | |
| 1930 | 1,457 | −0.8% | |
| 1940 | 1,289 | −11.5% | |
| 1950 | 1,031 | −20.0% | |
| 1960 | 1,075 | 4.3% | |
| 1970 | 967 | −10.0% | |
| 1980 | 1,187 | 22.8% | |
| 1990 | 1,025 | −13.6% | |
| 2000 | 887 | −13.5% | |
| 2010 | 929 | 4.7% | |
| 2020 | 827 | −11.0% | |
| U.S. Decennial Census[9] 1850–2010[10] 2010–2014[1] | |||
As of the census[11] of 2000, 887 people, 362 households, and 275 families were residing in the county. The population density was less than 1/km2 (1/sq mi). The 449 housing units averaged less than 1 per sq mi (0/km2). The racial makeup of the county was 96.51% White, 0.34% African American, 0.56% Native American, 0.11% Asian, 1.35% from other races, and 1.13% from two or more races. About 3.16% of the population was Hispanic or Latino of any race.
Of the 362 households, 31.8% had children under 18 living with them, 70.7% were married couples living together, 3.9% had a female householder with no husband present, and 24.0% were not families. About 23.8% of all households were made up of individuals, and 10.8% had someone living alone who was 65 or older. The average household size was 2.45, and the average family size was 2.88.
In the county, the age distribution was 25.0% under 18, 4.8% from 18 to 24, 24.8% from 25 to 44, 30.9% from 45 to 64, and 14.4% who were 65 or older. The median age was 42 years. For every 100 females, there were 100.20 males. For every 100 females age 18 and over, there were 97.30 males.
The median income for a household in the county was $44,792, and for a family was $50,400. Males had a median income of $33,125 versus $23,611 for females. The per capita income for the county was $20,923. About 5.00% of families and 7.20% of the population were below the poverty line, including 7.50% of those under age 18 and 5.50% of those age 65 or over.
The largest self-reported ancestry groups in Roberts County, Texas are:[12]
- 23.7% English
- 18.4% German
- 15.2% Irish
- 8.8% American
- 2.0% Scots-Irish
- 1.0% Polish
- 1.0% Russian
- 0.9% Czech
- 0.9% Welsh
- 0.7% Dutch
- 0.5% French
Government and politics
Roberts County was one of the earliest counties in Texas to turn Republican. The last Democrat to win the county in a presidential election was Harry S. Truman in 1948, when he carried nearly 76% of its ballots. No Democrat has since exceeded the 40% of the vote that Texas native Lyndon B. Johnson won in the county in his 1964 national landslide. Jimmy Carter in 1976 was the last Democrat to win even 30% of the county's vote.
In recent years, Roberts County has become almost unanimously Republican. In 2008, 92% of voters voted for Republican John McCain versus only 7.92% for Democrat Barack Obama, making it one of the most Republican counties in the United States.[13] In the 2016 presidential election, Republican Donald Trump received 94.58% of the vote,[14] the largest margin in a county for a Republican in the U.S. that election.[15][16][17] Roberts was again Trump's strongest county in 2020, and he won it by an even stronger margin: 96.2%-3.1% (see chart below).
The county is governed by an elected county judge and four commissioners (each elected by a precinct within the county).[18]
| Year | Republican | Democratic | Third parties |
|---|---|---|---|
| 2020 | 96.2% 529 | 3.1% 17 | 0.7% 4 |
| 2016 | 94.6% 524 | 3.6% 20 | 1.8% 10 |
| 2012 | 92.1% 468 | 6.5% 33 | 1.4% 7 |
| 2008 | 92.1% 477 | 7.9% 41 | |
| 2004 | 90.9% 461 | 9.1% 46 | |
| 2000 | 86.0% 472 | 13.1% 72 | 0.9% 5 |
| 1996 | 72.1% 421 | 20.9% 122 | 7.0% 41 |
| 1992 | 63.4% 391 | 20.4% 126 | 16.2% 100 |
| 1988 | 75.9% 441 | 23.2% 135 | 0.9% 5 |
| 1984 | 83.6% 539 | 16.4% 106 | |
| 1980 | 75.1% 482 | 23.4% 150 | 1.6% 10 |
| 1976 | 62.3% 350 | 35.9% 202 | 1.8% 10 |
| 1972 | 84.9% 467 | 12.9% 71 | 2.2% 12 |
| 1968 | 60.5% 311 | 17.5% 90 | 22.0% 113 |
| 1964 | 60.0% 297 | 40.0% 198 | |
| 1960 | 76.2% 339 | 23.4% 104 | 0.5% 2 |
| 1956 | 69.9% 279 | 29.6% 118 | 0.5% 2 |
| 1952 | 80.6% 379 | 19.4% 91 | |
| 1948 | 18.2% 76 | 75.8% 317 | 6.0% 25 |
| 1944 | 21.3% 89 | 69.1% 289 | 9.6% 40 |
| 1940 | 11.8% 55 | 87.6% 408 | 0.6% 3 |
| 1936 | 6.0% 27 | 94.0% 426 | |
| 1932 | 7.3% 36 | 91.9% 451 | 0.8% 4 |
| 1928 | 70.0% 243 | 30.0% 104 | |
| 1924 | 30.0% 104 | 69.5% 241 | 0.6% 2 |
| 1920 | 25.1% 60 | 72.4% 173 | 2.5% 6 |
| 1916 | 10.8% 27 | 87.7% 220 | 1.6% 4 |
| 1912 | 6.8% 16 | 77.2% 183 | 16.0% 38 |
See also
References
- "State & County QuickFacts". United States Census Bureau. Archived from the original on December 1, 2015. Retrieved December 23, 2013.
- "Find a County". National Association of Counties. Archived from the original on 2015-05-10. Retrieved 2011-06-07.
- "Texas: Individual County Chronologies". Texas Atlas of Historical County Boundaries. The Newberry Library. 2008. Archived from the original on May 13, 2015. Retrieved May 26, 2015.
- "TABC Local Option Elections General Information". www.tabc.state.tx.us. Archived from the original on 2018-07-29. Retrieved 2018-07-29.
- "Roberts County, Texas". Genealogy, Inc. Archived from the original on 2010-09-14. Retrieved 2010-10-05.
- Berfield, Susan (June 12, 2008). "There Will Be Water". Business Week. Archived from the original on 2010-10-09. Retrieved 2010-10-04.
- "2010 Census Gazetteer Files". United States Census Bureau. August 22, 2012. Archived from the original on April 19, 2015. Retrieved May 9, 2015.
- "Mesa Vista Ranch" (PDF). Archived from the original (PDF) on 2011-05-01. Retrieved 2010-10-04.(11.9MB)
- "U.S. Decennial Census". United States Census Bureau. Archived from the original on October 3, 2014. Retrieved May 9, 2015.
- "Texas Almanac: Population History of Counties from 1850–2010" (PDF). Texas Almanac. Archived (PDF) from the original on February 26, 2015. Retrieved May 9, 2015.
- "U.S. Census website". United States Census Bureau. Archived from the original on 1996-12-27. Retrieved 2011-05-14.
- "Archived copy". Archived from the original on 2021-07-17. Retrieved 2021-07-17.CS1 maint: archived copy as title (link)
- "2008 Presidential General Election Results - Roberts County, TX". uselectionatlas.org. Archived from the original on 2018-07-29. Retrieved 2018-07-29.
- "2016 Presidential General Election Results – Texas". Dave Leip's U.S. Election Atlas. Archived from the original on December 29, 2016. Retrieved December 16, 2016.
- Coleman, Mary (November 17, 2016). "'Most Pro-Trump County in U.S.' Getting New, Unwanted Attention". newschannel10.com. Archived from the original on December 20, 2016. Retrieved December 17, 2016.
- "Texas Home To 'Reddest County In America'". CBS DFW. November 17, 2016. Archived from the original on December 20, 2016. Retrieved December 17, 2016.
- "A year in the most pro-Trump town in America". ABC News. 17 January 2018. Archived from the original on 28 June 2020. Retrieved 28 June 2020.
- "Commissioners Court". Archived from the original on 2011-05-14. Retrieved 2010-10-05.
- Leip, David. "Dave Leip's Atlas of U.S. Presidential Elections". uselectionatlas.org. Archived from the original on 2018-03-23. Retrieved 2008-12-22.
External links
- Roberts County government’s website
- Roberts County from the Handbook of Texas Online
- Roberts County Profile from the Texas Association of Counties
Places adjacent to Roberts County, Texas | ||||||||||||||||
|---|---|---|---|---|---|---|---|---|---|---|---|---|---|---|---|---|
| ||||||||||||||||


Municipalities and communities of Roberts County, Texas, United States | ||
|---|---|---|
| City | Roberts County map | |
| Unincorporated community | ||
| ||

Authority control  | |
|---|---|
| General | |
| National libraries | |
| Other | |