1967 elections in India
The elections in India in 1967 included the 1967 Indian general election and nine state legislative assembly elections.
 |
|---|
 India portal India portal |

General election
 | |||||
| Party | Votes | % | Seats | +/– | |
|---|---|---|---|---|---|
| Indian National Congress | 59,490,701 | 40.78 | 283 | –78 | |
| Bharatiya Jana Sangh | 13,580,935 | 9.31 | 35 | +21 | |
| Swatantra Party | 12,646,847 | 8.67 | 44 | +26 | |
| Communist Party of India | 7,458,396 | 5.11 | 23 | –6 | |
| Samyukta Socialist Party | 7,171,627 | 4.92 | 23 | New | |
| Communist Party of India (Marxist) | 6,246,522 | 4.28 | 19 | New | |
| Dravida Munnetra Kazhagam | 5,529,405 | 3.79 | 25 | +18 | |
| Praja Socialist Party | 4,456,487 | 3.06 | 13 | +1 | |
| Republican Party of India | 3,607,711 | 2.47 | 1 | –2 | |
| Bangla Congress | 1,204,356 | 0.83 | 5 | New | |
| Peasants and Workers Party of India | 1,028,755 | 0.71 | 2 | +2 | |
| Akali Dal – Sant Fateh Singh | 968,712 | 0.66 | 3 | New | |
| All India Forward Bloc | 627,910 | 0.43 | 2 | 0 | |
| Indian Union Muslim League | 413,868 | 0.28 | 2 | 0 | |
| Kerala Congress | 321,219 | 0.22 | 0 | New | |
| Jammu & Kashmir National Conference | 210,020 | 0.14 | 1 | New | |
| Akali Dal – Master Tara Singh | 189,290 | 0.13 | 0 | New | |
| Jana Kranti Dal | 183,211 | 0.13 | 1 | New | |
| Jana Congress | 136,631 | 0.09 | 0 | New | |
| All Party Hill Leaders Conference | 112,492 | 0.08 | 1 | 0 | |
| United Goans – Seqveria Group | 100,137 | 0.07 | 1 | New | |
| Peoples Front | 42,725 | 0.03 | 0 | New | |
| Democratic National Conference | 30,788 | 0.02 | 0 | New | |
| United Goans – Furtadd Group | 1,714 | 0.00 | 0 | New | |
| Nagaland Nationalist Organisation | 0 | 0.00 | 1 | New | |
| Independents | 20,106,051 | 13.78 | 35 | +15 | |
| Appointed members[lower-alpha 1] | 3 | –11 | |||
| Total | 145,866,510 | 100.00 | 523 | +15 | |
| Valid votes | 145,866,510 | 95.51 | |||
| Invalid/blank votes | 6,858,101 | 4.49 | |||
| Total votes | 152,724,611 | 100.00 | |||
| Registered voters/turnout | 250,207,401 | 61.04 | |||
| Source: ECI | |||||
- Two representing Anglo-Indians and one representing the North-East Frontier Agency.
Legislative Assembly elections
Bihar
| Party | Votes | % | Seats | +/– | |
|---|---|---|---|---|---|
| Indian National Congress | 4,479,460 | 33.09 | 128 | –57 | |
| Sanghata Socialist Party | 2,385,961 | 17.62 | 68 | New | |
| Bharatiya Jana Sangh | 1,410,722 | 10.42 | 26 | +23 | |
| Praja Socialist Party | 942,889 | 6.96 | 18 | –11 | |
| Communist Party of India | 935,977 | 6.91 | 24 | +12 | |
| Jan Kranti Dal | 451,412 | 3.33 | 13 | New | |
| Swatantra Party | 315,184 | 2.33 | 3 | –47 | |
| Communist Party of India (Marxist) | 173,656 | 1.28 | 4 | New | |
| Republican Party of India | 23,893 | 0.18 | 1 | New | |
| Independents | 2,419,469 | 17.87 | 33 | –21 | |
| Total | 13,538,623 | 100.00 | 318 | 0 | |
| Valid votes | 13,538,623 | 73.37 | |||
| Invalid/blank votes | 4,914,436 | 26.63 | |||
| Total votes | 18,453,059 | 100.00 | |||
| Registered voters/turnout | 27,743,190 | 66.51 | |||
| Source: ECI[1] | |||||
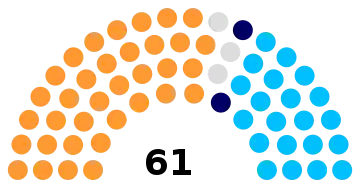
Delhi
 | ||||||
| Party | Seats | |||||
|---|---|---|---|---|---|---|
| Elected | Nominated | Total | ||||
| Bharatiya Jana Sangh | 33 | 2 | 35 | |||
| Indian National Congress | 19 | 2 | 21 | |||
| Republican Party of India | 2 | 0 | 2 | |||
| Independents | 2 | 1 | 3 | |||
| Total | 56 | 5 | 61 | |||
| Source: Parveen,[2] Delhi Gazetteer[3] | ||||||
Goa, Daman and Diu
| Political Party |
Seats contested |
Seats won |
Number of Votes |
% of Votes | |
|---|---|---|---|---|---|
| Maharashtrawadi Gomantak Party | 26 | 16 | 111,110 | 40.42% | |
| United Goans Party (Sequeira Group) | 30 | 12 | 104,426 | 37.98% | |
| Independents | 156 | 2 | 48,471 | 17.63% | |
| Total[5] | 226 | 30 | 264.007 | 100% | |
Himachal Pradesh
| Rank | Party | Seats Contested | Seats won | % votes |
|---|---|---|---|---|
| 1 | Indian National Congress | 60 | 34 | 42.19 |
| 2 | Independent | 60 | 16 | 38.10 |
| 3 | Bharatiya Jana Sangh | 33 | 7 | 13.87 |
| 4 | CPI | 11 | 2 | 2.89 |
| 5 | Swatantra Party | 5 | 1 | 1.93 |
| Total | 60 |
Source:[6]
Jammu and Kashmir
Madras
| Alliances | Party | Popular Vote | Vote % | Seats contested | Seats won | Change |
|---|---|---|---|---|---|---|
| United Front[9]
|
Dravida Munnetra Kazhagam | 6,230,552 | 40.69% | 174 | 137 |  87 87 |
| Swatantra Party | 811,232 | 5.30% | 27 | 20 | 12 | |
| Communist Party of India (Marxist) | 623,114 | 4.07% | 22 | 11 | 11 | |
| Praja Socialist Party | 136,188 | 0.89% | 4 | 4 | 4 | |
| Indian Union Muslim League | 95,494 | 0.62% | 3 | 3 | 3 | |
| Sanghata Socialist Party | 84,188 | 0.55% | 3 | 2 | 2 | |
| DMK Backed Independents | 70,665 | 0.46% | 2 | 2 | 2 | |
| Indian National Congress Seats: 51 Seat Change:  84 84Popular Vote: 6,293,378 Popular Vote %: 41.10% |
Indian National Congress | 6,293,378 | 41.10% | 232 | 51 | 84 |
| Others Seats: 4 Seat Change: 4 |
Independents | 591,214 | 3.86% | 246 | 1 | 4 |
| Communist Party of India | 275,932 | 1.80% | 32 | 2 |  | |
| Forward Bloc | 44,714 | 0.29% | 1 | 1 | | |
| Republican Party of India | 31,286 | 0.20% | 13 | 0 | | |
| Bharatiya Jana Sangh | 22,745 | 0.15% | 24 | 0 | | |
| Total | 11 Political Parties | 15,310,702 | 100% | — | 234 | 28 |
Maharashtra
| Political Party |
No. of candidates |
No. of elected |
Number of Votes |
% of Votes |
Seat change | |
|---|---|---|---|---|---|---|
| Indian National Congress | 270 | 203 | 6,288,564 | 47.03% | 12 | |
| Peasants and Workers Party of India | 58 | 19 | 1,043,239 | 7.80% | 4 | |
| Communist Party of India | 41 | 10 | 651,077 | 4.87% | 4 | |
| Praja Socialist Party | 66 | 8 | 545,935 | 4.08% | 1 | |
| Republican Party of India | 79 | 5 | 890,377 | 6.66% | 5 | |
| Bharatiya Jana Sangh | 166 | 4 | 1,092,670 | 8.17% | 4 | |
| Samyukta Socialist Party | 48 | 4 | 616,466 | 4.61% | 4 | |
| Communist Party of India (Marxist) | 11 | 1 | 145,083 | 1.08% | 1 | |
| Independents | 463 | 16 | 1,948,223 | 14.57% | 1 | |
| Total | 1242 | 270 | 13,371,735 |
Manipur
 | |||||
| Party | Votes | % | Seats | +/– | |
|---|---|---|---|---|---|
| Indian National Congress | 101,504 | 32.53 | 16 | New | |
| Sanghata Socialist Party | 36,520 | 11.70 | 4 | New | |
| Communist Party of India | 17,062 | 5.47 | 1 | New | |
| Praja Socialist Party | 2,417 | 0.77 | 0 | New | |
| Communist Party of India (Marxist) | 2,093 | 0.67 | 0 | New | |
| Independents | 152,419 | 48.85 | 9 | New | |
| Total | 312,015 | 100.00 | 30 | 0 | |
| Valid votes | 312,015 | 82.00 | |||
| Invalid/blank votes | 68,505 | 18.00 | |||
| Total votes | 380,520 | 100.00 | |||
| Registered voters/turnout | 468,707 | 81.19 | |||
| Source: ECI[10] | |||||
West Bengal
| Political Party |
No. of candidates |
No. of elected |
Number of Votes |
% of Votes |
Seat change | |
|---|---|---|---|---|---|---|
| Indian National Congress | 280 | 127 | 5,207,930 | 41.13% | 30 | |
| Communist Party of India (Marxist) | 135 | 43 | 2,293,026 | 18.11% | 43 | |
| Bangla Congress | 80 | 34 | 1,286,028 | 10.16% | 34 | |
| Communist Party of India | 62 | 16 | 827,196 | 6.53% | 34 | |
| All India Forward Bloc | 42 | 13 | 561,148 | 4.43% | | |
| Samyukta Socialist Party | 26 | 7 | 269,234 | 2.13% | 7 | |
| Praja Socialist Party | 26 | 7 | 238,694 | 1.88% | 2 | |
| Revolutionary Socialist Party | 16 | 6 | 238,694 | 2.14% | 2 | |
| Socialist Unity Centre of India | 8 | 4 | 238,694 | 0.72% | 1 | |
| Marxist Forward Bloc | 58 | 1 | 167,934 | 1.33% | 1 | |
| Revolutionary Communist Party of India | 58 | 1 | 167,934 | 1.33% | 8 | |
| Bharatiya Jana Sangh | 58 | 1 | 167,934 | 1.33% | 1 | |
| Swatantra Party | 21 | 1 | 102,576 | 0.81% | 1 | |
| Independents | 327 | 31 | 1,708,011 | 13.49% | 20 | |
| Total | 1058 | 280 | 12,663,030 |
References
- "Statistical Report on General Election, 1967 to the Legislative Assembly of Bihar". Election Commission of India. Retrieved 29 November 2021.
- Nazima Parveen (2021). Contested Homelands: Politics of Space and Identity. Bloomsbury Publishing. ISBN 9789389000917.
BJS won thirty-three of fifty-six seats of the Delhi Metropolitan Council election in 1967..
- Radha Raman, ed. (1 April 1976). "Delhi Gazetteer - 1976". Delhi. p. 974.
- "STATISTICAL REPORT ON GENERAL ELECTION, 1967 TO THE LEGISLATIVE ASSEMBLY OF GOA DAMAN & DIU" (PDF). Election Commission of India.
- The total includes votes and contestants of all parties, even those who failed to win one seat
- STATISTICAL REPORT ON GENERAL ELECTION, 1967 TO THE LEGISLATIVE ASSEMBLY OF HIMACHAL PRADESH
- http://www.assembly.tn.gov.in/archive/3rd_1962/Review%203_62-67.pdf
- "Tamil Nadu 1967".
- Siddhartan, N. S. (17 June 1967). "Voting Pattern in the Fourth General Election. I: D M K Success in Madras". Economic and Political Weekly. 2 (24): 1083–88. JSTOR 4358065.
- "Statistical Report on General Election, 1967 to the Legislative Assembly of Manipur". Election Commission of India. Retrieved 20 October 2021.
- "eci.nic.in" (PDF).
External links
 |
Wikimedia Commons has media related to 1967 elections in India. |
| General elections | |
|---|---|
| State elections |
|
| |
This article is issued from Wikipedia. The text is licensed under Creative Commons - Attribution - Sharealike. Additional terms may apply for the media files.