San Pablo, Isabela
San Pablo, officially the Municipality of San Pablo (Ibanag: Ili nat San Pablo; Ilocano: Ili ti San Pablo; Tagalog: Bayan ng San Pablo), is a 2nd class municipality in the province of Isabela, Philippines. According to the 2020 census, it has a population of 26,320 people. [4]
San Pablo | |
|---|---|
| Municipality of San Pablo | |
 San Pablo de Cabigan Church Ruin | |
 Seal | |
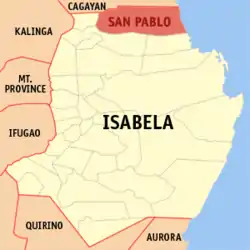 Map of Isabela with San Pablo highlighted | |
OpenStreetMap 
| |
.svg.png.webp)  San Pablo Location within the Philippines | |
| Coordinates: 17°28′59″N 121°59′16″E | |
| Country | Philippines |
| Region | Cagayan Valley |
| Province | Isabela |
| District | 1st district |
| Named for | St. Paul the Apostle[1] |
| Barangays | 17 (see Barangays) |
| Government | |
| • Type | Sangguniang Bayan |
| • Mayor | Antonio N. Miro, Jr. |
| • Vice Mayor | Antonio Jose T. Miro III |
| • Representative | Antonio T. Albano |
| • Electorate | 16,206 voters (2019) |
| Area | |
| • Total | 637.90 km2 (246.29 sq mi) |
| Elevation | 41 m (135 ft) |
| Highest elevation | 168 m (551 ft) |
| Lowest elevation | 14 m (46 ft) |
| Population | |
| • Total | 26,320 |
| • Density | 41/km2 (110/sq mi) |
| • Households | 5,072 |
| Economy | |
| • Income class | 2nd municipal income class |
| • Poverty incidence | 20.73% (2015)[5] |
| • Revenue | ₱203,913,447.72 (2020) |
| • Assets | ₱494,940,831.31 (2020) |
| • Expenditure | ₱144,313,978.68 (2020) |
| • Liabilities | ₱88,742,956.63 (2020) |
| Service provider | |
| • Electricity | Isabela 2 Electric Cooperative (ISELCO 2) |
| Time zone | UTC+8 (PST) |
| ZIP code | 3329 |
| PSGC | |
| IDD : area code | +63 (0)78 |
| Native languages | Ibanag Ilocano Tagalog |
| Website | www |
History
The town was founded on 1646 as Maquila by Fr. Pedro de Santo Tomas, making it the oldest town in Isabela and existing before the province's creation. The original name literally means sparkling. It was then renamed to Cabagan, loosely interpreted as the place where people wear "ba-ag" or "G-strings" when the Spaniards arrived at the Philippine Islands.
In 1900s, Cabagan was subdivided into three divisions, namely: Cabagan Viejo, Cabagan Nuevo, and Santa Maria. Cabagan Viejo was then renamed to San Pablo, after its patron saint Paul the Apostle whose feast day is celebrated every January 15. Meanwhile, Cabagan Nuevo became the modern-day Cabagan, while Santa Maria retained its name.[1]
Barangays
San Pablo is politically subdivided into 17 barangays. [6]
- Annanuman
- Auitan
- Ballacayu
- Binguang
- Bungad
- Dalena
- Caddangan/Limbauan
- Calamagui
- Caralucud
- Guminga
- Minanga Norte
- Minanga Sur
- San Jose
- Poblacion
- Simanu Norte
- Simanu Sur
- Tupa (San Vicente)
Climate
| Climate data for San Pablo, Isabela | |||||||||||||
|---|---|---|---|---|---|---|---|---|---|---|---|---|---|
| Month | Jan | Feb | Mar | Apr | May | Jun | Jul | Aug | Sep | Oct | Nov | Dec | Year |
| Average high °C (°F) | 29 (84) |
30 (86) |
32 (90) |
35 (95) |
35 (95) |
35 (95) |
34 (93) |
33 (91) |
32 (90) |
31 (88) |
30 (86) |
28 (82) |
32 (90) |
| Average low °C (°F) | 19 (66) |
20 (68) |
21 (70) |
23 (73) |
23 (73) |
24 (75) |
23 (73) |
23 (73) |
23 (73) |
22 (72) |
21 (70) |
20 (68) |
22 (71) |
| Average precipitation mm (inches) | 31.2 (1.23) |
23 (0.9) |
27.7 (1.09) |
28.1 (1.11) |
113.5 (4.47) |
141.4 (5.57) |
176.4 (6.94) |
236.6 (9.31) |
224.9 (8.85) |
247.7 (9.75) |
222.9 (8.78) |
178 (7.0) |
1,651.4 (65) |
| Average rainy days | 10 | 6 | 5 | 5 | 13 | 12 | 15 | 15 | 15 | 17 | 16 | 15 | 144 |
| Source: World Weather Online[7] | |||||||||||||
Demographics
|
| |||||||||||||||||||||||||||||||||||||||||||||||||||
| Source: Philippine Statistics Authority [8] [9] [10][11] | ||||||||||||||||||||||||||||||||||||||||||||||||||||
In the 2020 census, the population of San Pablo, Isabela, was 26,320 people, [4] with a density of 41 inhabitants per square kilometre or 110 inhabitants per square mile.
Economy
| Poverty Incidence of San Pablo | |
| Source: Philippine Statistics Authority[12][13][14][15][16][17] | |
References
- "Executive Summary" (PDF). Commission on Audit. Retrieved November 5, 2021.
- Municipality of San Pablo | (DILG)
- "2015 Census of Population, Report No. 3 – Population, Land Area, and Population Density" (PDF). Philippine Statistics Authority. Quezon City, Philippines. August 2016. ISSN 0117-1453. Archived (PDF) from the original on May 25, 2021. Retrieved July 16, 2021.
- Census of Population (2020). "Region II (Cagayan Valley)". Total Population by Province, City, Municipality and Barangay. PSA. Retrieved 8 July 2021.
- https://psa.gov.ph/sites/default/files/City%20and%20Municipal-level%20Small%20Area%20Poverty%20Estimates_%202009%2C%202012%20and%202015_0.xlsx; publication date: 10 July 2019; publisher: Philippine Statistics Authority.
- "Province: Isabela". PSGC Interactive. Quezon City, Philippines: Philippine Statistics Authority. Retrieved 12 November 2016.
- "San Pablo, Isabela: Average Temperatures and Rainfall". World Weather Online. Retrieved 3 November 2015.
- Census of Population (2015). "Region II (Cagayan Valley)". Total Population by Province, City, Municipality and Barangay. PSA. Retrieved 20 June 2016.
- Census of Population and Housing (2010). "Region II (Cagayan Valley)". Total Population by Province, City, Municipality and Barangay. NSO. Retrieved 29 June 2016.
- Censuses of Population (1903–2007). "Region II (Cagayan Valley)". Table 1. Population Enumerated in Various Censuses by Province/Highly Urbanized City: 1903 to 2007. NSO.
- "Province of Isabela". Municipality Population Data. Local Water Utilities Administration Research Division. Retrieved 17 December 2016.
- "Poverty incidence (PI):". Philippine Statistics Authority. Retrieved 28 December 2020.
- https://psa.gov.ph/sites/default/files/NSCB_LocalPovertyPhilippines_0.pdf; publication date: 29 November 2005; publisher: Philippine Statistics Authority.
- https://psa.gov.ph/sites/default/files/2003%20SAE%20of%20poverty%20%28Full%20Report%29_1.pdf; publication date: 23 March 2009; publisher: Philippine Statistics Authority.
- https://psa.gov.ph/sites/default/files/2006%20and%202009%20City%20and%20Municipal%20Level%20Poverty%20Estimates_0_1.pdf; publication date: 3 August 2012; publisher: Philippine Statistics Authority.
- https://psa.gov.ph/sites/default/files/2012%20Municipal%20and%20City%20Level%20Poverty%20Estima7tes%20Publication%20%281%29.pdf; publication date: 31 May 2016; publisher: Philippine Statistics Authority.
- https://psa.gov.ph/sites/default/files/City%20and%20Municipal-level%20Small%20Area%20Poverty%20Estimates_%202009%2C%202012%20and%202015_0.xlsx; publication date: 10 July 2019; publisher: Philippine Statistics Authority.
External links
- San Pablo Profile at PhilAtlas.com
- Municipal Profile at the National Competitiveness Council of the Philippines
- San Pablo at the Isabela Government Website
- Local Governance Performance Management System
- Philippine Standard Geographic Code
- Philippine Census Information
- Municipality of San Pablo
Places adjacent to San Pablo, Isabela | ||||||||||||||||
|---|---|---|---|---|---|---|---|---|---|---|---|---|---|---|---|---|
| ||||||||||||||||


 Province of Isabela Province of Isabela | |
|---|---|
Ilagan (capital) | |
| Municipalities |
|
| Component Cities | |
| Independent Component City |
|
| Barangays | |
Authority control  | |
|---|---|
| General | |
| National libraries | |