1965 Japanese House of Councillors election
House of Councillors elections were held in Japan on 4 July 1965,[1] electing half the seats in the House. The Liberal Democratic Party won the most seats.
 | |||||||||||||||||||||||||||||||||||||||||||||||||||||||||||||
127 of the 251 seats in the House of Councillors 126 seats needed for a majority | |||||||||||||||||||||||||||||||||||||||||||||||||||||||||||||
|---|---|---|---|---|---|---|---|---|---|---|---|---|---|---|---|---|---|---|---|---|---|---|---|---|---|---|---|---|---|---|---|---|---|---|---|---|---|---|---|---|---|---|---|---|---|---|---|---|---|---|---|---|---|---|---|---|---|---|---|---|---|
| |||||||||||||||||||||||||||||||||||||||||||||||||||||||||||||
| |||||||||||||||||||||||||||||||||||||||||||||||||||||||||||||
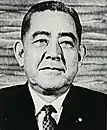


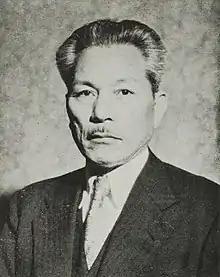
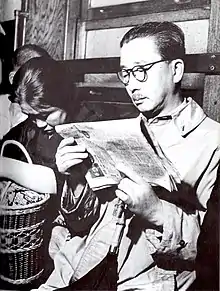

 |
|---|
|
Japan portal |

_Flag.svg.png.webp)


Results
| Party | National | Constituency | Seats | |||||||||
|---|---|---|---|---|---|---|---|---|---|---|---|---|
| Votes | % | Seats | Votes | % | Seats | Not up | Won | Total after | +/– | |||
| Liberal Democratic Party | 17,583,490 | 47.17 | 25 | 16,651,284 | 44.20 | 46 | 69 | 71 | 140 | –2 | ||
| Japan Socialist Party | 8,729,655 | 23.42 | 12 | 12,346,650 | 32.77 | 24 | 37 | 36 | 73 | +7 | ||
| Kōmeitō | 5,097,682 | 13.68 | 9 | 1,910,975 | 5.07 | 2 | 9 | 11 | 20 | +5 | ||
| Democratic Socialist Party | 2,214,375 | 5.94 | 2 | 2,303,860 | 6.12 | 1 | 4 | 3 | 7 | –4 | ||
| Japanese Communist Party | 1,652,364 | 4.43 | 2 | 2,608,771 | 6.92 | 1 | 1 | 3 | 4 | 0 | ||
| Other parties | 298,401 | 0.80 | 0 | 185,991 | 0.49 | 0 | 0 | 0 | 0 | 0 | ||
| Independents | 1,700,849 | 4.56 | 2 | 1,664,639 | 4.42 | 1 | 4 | 3 | 7 | +2 | ||
| Total | 37,276,816 | 100.00 | 52 | 37,672,170 | 100.00 | 75 | 124 | 127 | 251 | +1 | ||
| Valid votes | 37,276,816 | 93.42 | 37,672,170 | 94.41 | ||||||||
| Invalid/blank votes | 2,624,119 | 6.58 | 2,232,535 | 5.59 | ||||||||
| Total votes | 39,900,935 | 100.00 | 39,904,705 | 100.00 | ||||||||
| Registered voters/turnout | 59,544,407 | 67.01 | 59,544,407 | 67.02 | ||||||||
| Source: Ministry of Internal Affairs and Communications,[1][2] National Diet | ||||||||||||
References
- Table 13: Persons Elected and Votes Polled by Political Parties - Ordinary Elections for the House of Councillors (1947–2004) Archived 2011-03-23 at the Wayback Machine Ministry of Internal Affairs and Communications
- "27-11 Allotted Number, Candidates, Eligible Voters as of Election Day, Voters and Voting Percentages of Ordinary Elections for the House of Councillors (1947-2004)". Ministry of Internal Affairs and Communications.
| General elections | |
|---|---|
| Councillors elections | |
| Unified local elections | |
| Supreme Court retention elections |
|
| |
This article is issued from Wikipedia. The text is licensed under Creative Commons - Attribution - Sharealike. Additional terms may apply for the media files.