1976 West German federal election
Federal elections were held in West Germany on 3 October 1976 to elect the members of the 8th Bundestag. Although the CDU/CSU alliance became the largest faction in parliament, Helmut Schmidt of the Social Democratic Party remained Chancellor.
 | |||||||||||||||||||||||||||||||||||||
All 496 seats in the Bundestag[lower-alpha 1] 249 seats needed for a majority | |||||||||||||||||||||||||||||||||||||
|---|---|---|---|---|---|---|---|---|---|---|---|---|---|---|---|---|---|---|---|---|---|---|---|---|---|---|---|---|---|---|---|---|---|---|---|---|---|
| Registered | 42,058,015  1.5% 1.5% | ||||||||||||||||||||||||||||||||||||
| Turnout | 38,165,753 (90.7%)  0.4pp 0.4pp | ||||||||||||||||||||||||||||||||||||
| |||||||||||||||||||||||||||||||||||||
 Results by constituency for the first votes. Grey denotes seats won by the CDU/CSU; red denotes seats won by the SPD. | |||||||||||||||||||||||||||||||||||||
| |||||||||||||||||||||||||||||||||||||
.jpg.webp)

 |
|---|
|
Campaign
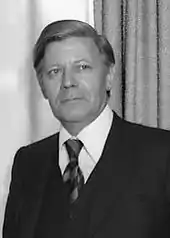
The coalition of the SPD and the FDP wanted to be re-elected, with the SPD, since 1974 led by Helmut Schmidt, the party's candidate for Chancellor. The CDU and the CSU tried to achieve an absolute majority of the votes to make CDU chairman Helmut Kohl Chancellor.
Results
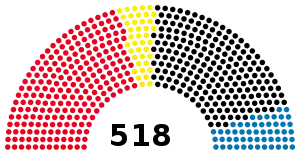 | ||||||||||||||
|---|---|---|---|---|---|---|---|---|---|---|---|---|---|---|
| Party | Constituency | Party list | Total seatsa |
+/– | ||||||||||
| Votes | % | Seats | Votes | % | Seats | |||||||||
| Social Democratic Party (SPD) | 16,471,321 | 43.7 | 114 | 16,099,019 | 42.6 | 100 | 214 | −16 | ||||||
| Christian Democratic Union (CDU) | 14,423,157 | 38.3 | 94 | 14,367,302 | 38.0 | 96 | 190 | +13 | ||||||
| Christian Social Union (CSU) | 4,008,514 | 10.6 | 40 | 4,008,514 | 10.6 | 13 | 53 | +5 | ||||||
| Free Democratic Party (FDP) | 2,417,683 | 6.4 | 0 | 2,995,085 | 7.9 | 39 | 39 | −2 | ||||||
| National Democratic Party (NPD) | 136,028 | 0.4 | 0 | 122,661 | 0.3 | 0 | 0 | 0 | ||||||
| German Communist Party (DKP) | 170,855 | 0.5 | 0 | 118,581 | 0.3 | 0 | 0 | 0 | ||||||
| Communist Party of Germany (KPD-AO) | 8,822 | 0.0 | 0 | 22,714 | 0.1 | 0 | 0 | New | ||||||
| Action Community of Independent Germans (AUD) | 19,490 | 0.1 | 0 | 22,202 | 0.1 | 0 | 0 | 0 | ||||||
| Communist League of West Germany (KBW) | 21,414 | 0.0 | 0 | 20,018 | 0.1 | 0 | 0 | New | ||||||
| European Workers' Party (EAP) | 3,177 | 0.0 | 0 | 6,811 | 0.0 | 0 | 0 | New | ||||||
| Christian Bavarian People's Party (CBV) | 4,876 | 0.0 | 0 | 6,720 | 0.0 | 0 | 0 | New | ||||||
| International Marxist Group (GIM) | 2,037 | 0.0 | 0 | 4,759 | 0.0 | 0 | 0 | New | ||||||
| Action Community Fourth Party (AVP) | 2,636 | 0.0 | 0 | 4,723 | 0.0 | 0 | 0 | New | ||||||
| 5%-Block | 985 | 0.0 | 0 | 2,940 | 0.0 | 0 | 0 | New | ||||||
| Independent Workers' Party (UAP) | 499 | 0.0 | 0 | 765 | 0.0 | 0 | 0 | 0 | ||||||
| United Left (VL) | 217 | 0.0 | 0 | 701 | 0.0 | 0 | 0 | New | ||||||
| Right and Freedom Party (RFP) | 227 | 0.0 | 0 | – | – | – | 0 | New | ||||||
| Independents and voter groups | 3,706 | 0.0 | 0 | – | – | – | 0 | 0 | ||||||
| Valid votes | 37,695,644 | 98.8 | – | 37,822,500 | 99.1 | – | – | – | ||||||
| Invalid/blank votes | 470,109 | 1.2 | – | 343,253 | 0.9 | – | – | – | ||||||
| Total votes | 38,165,753 | 100.0 | 248 | 38,165,753 | 100.0 | 248 | 496 | 0 | ||||||
| Registered voters/turnout | 42,058,015 | 90.7 | – | 42,058,015 | 90.7 | – | – | – | ||||||
| Source: Bundeswahlleiter | ||||||||||||||
- ^a – excludes the non-voting delegates representing West Berlin (11 CDU, 10 SPD, 1 FDP).
| 214 | 39 | 243 |
| SPD | FDP | CDU/CSU |
Aftermath
The coalition between the SPD and the FDP remained in government, with Helmut Schmidt as Chancellor. Between the "sister parties" of CDU and Bavarian CSU there emerged a critical conflict, as the CSU leader Franz Josef Strauß wanted to break both the united Bundestag group of the parties and the agreement not to compete against each other in any Land. Later, this attack was withdrawn, while Strauß became candidate for chancellor for the 1980 elections.
Notes
 |
Wikimedia Commons has media related to 1976 Germany Bundestagswahl. |
- As well as the 22 non-voting delegates representing West Berlin, elected by the West Berlin Legislature.
- As well as the 11 non-voting delegates for West Berlin.
- As well as the 10 non-voting delegates for West Berlin.
- As well as the 1 non-voting delegates for West Berlin.
References
External links
| Parliamentary elections | |
|---|---|
| Presidential elections | |
| European elections | |
| Referendums | |
| |