1984 European Parliament election in West Germany
The European Parliament election of 1984 in West Germany was the election of the delegation from West Germany to the European Parliament in 1984.
 | |||||||||||||||||||||||||||||||||
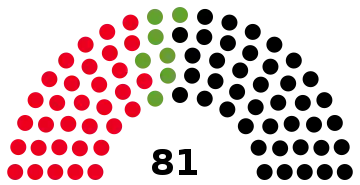
All 81 German seats in the European Parliament | |||||||||||||||||||||||||||||||||
|---|---|---|---|---|---|---|---|---|---|---|---|---|---|---|---|---|---|---|---|---|---|---|---|---|---|---|---|---|---|---|---|---|---|
| Turnout | 56.8% | ||||||||||||||||||||||||||||||||
| |||||||||||||||||||||||||||||||||


Results
 | |||||
| Party | Votes | % | Seats | +/– | |
|---|---|---|---|---|---|
| Christian Democratic Union | 9,308,411 | 37.46 | 34 | 0 | |
| Social Democratic Party | 9,296,417 | 37.41 | 33 | –2 | |
| Christian Social Union | 2,109,130 | 8.49 | 7 | –1 | |
| The Greens | 2,025,972 | 8.15 | 7 | +7 | |
| Free Democratic Party | 1,192,624 | 4.80 | 0 | –4 | |
| Peace List | 313,108 | 1.26 | 0 | New | |
| National Democratic Party | 198,633 | 0.80 | 0 | New | |
| Women's Party | 94,463 | 0.38 | 0 | New | |
| Centre Party | 93,921 | 0.38 | 0 | New | |
| Ecological Democratic Party | 77,026 | 0.31 | 0 | New | |
| Mature Citizens | 52,753 | 0.21 | 0 | New | |
| European Federalist Party | 34,500 | 0.14 | 0 | New | |
| European Workers' Party | 30,874 | 0.12 | 0 | 0 | |
| Bavaria Party | 23,539 | 0.09 | 0 | New | |
| Total | 24,851,371 | 100.00 | 81 | 0 | |
| Valid votes | 24,851,371 | 98.47 | |||
| Invalid/blank votes | 387,383 | 1.53 | |||
| Total votes | 25,238,754 | 100.00 | |||
| Registered voters/turnout | 44,465,989 | 56.76 | |||
| Source: Federal Statistics Office | |||||
References
- "Wahl zum 2. Europäischen Parlament am 17. Juni 1984" (in German). Bundeswahlleiter. Archived from the original on 8 August 2012. Retrieved 5 May 2012.
| Parliamentary elections | |
|---|---|
| Presidential elections | |
| European elections | |
| Referendums | |
| |
This article is issued from Wikipedia. The text is licensed under Creative Commons - Attribution - Sharealike. Additional terms may apply for the media files.