Hayle North (electoral division)
Hayle North (Cornish: Heyl North)[1] was an electoral division of Cornwall in the United Kingdom which returned one member to sit on Cornwall Council between 2009 to 2021. It was abolished at the 2021 local elections, being succeeded by Gwinear-Gwithian and Hayle East and Hayle West.
| Hayle North | |
|---|---|
| Former ward Cornwall Council. | |
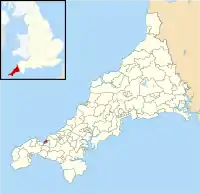 Boundary of Hayle North in Cornwall from 2013-2021. | |
| County | Cornwall |
| 2013–2021 | |
| Number of councillors | One |
| Replaced by | Gwinear-Gwithian and Hayle East Hayle West |
| Created from | Hayle North |
| 2009–2013 | |
| Number of councillors | One |
| Replaced by | Hayle North |
| Created from | Council created |
An electoral division of the same name returned one member to Cornwall County Council between 1985 to 2005, when it was merged into the Hayle-Gwinear-Gwithian division.
Councillors
Cornwall Council
| Election | Member | Party | |
|---|---|---|---|
| 2009 | John Pollard | Independent | |
| 2013 | |||
| 2017 | |||
| 2021 | Seat abolished | ||
Cornwall County Council
| Election | Member | Party | |
|---|---|---|---|
| 1985 | H. Johns | Independent | |
| 1989 | |||
| 1993 | |||
| 1997 | P. Batty | Liberal Democrat | |
| 2001 | T. Lello | ||
| 2005 | Seat abolished | ||
Extent
In its most recent form, Hayle North represented the north of Hayle including The Towans, Phillack, Ventonleague, Guildford and most of Copperhouse (some of which was covered by the Hayle South division).[2] The division was affected by boundary changes at the 2013 election. Before boundary changes, the division covered 432 hectares in total; after, it covered 419 hectares.[2][3]
Election results
2017 election
| Party | Candidate | Votes | % | ±% | |
|---|---|---|---|---|---|
| Independent | John Pollard | 821 | 69.5 | ||
| Conservative | Philip Southwood | 219 | 18.5 | ||
| Liberal Democrats | Mary McWilliams | 136 | 11.5 | ||
| Majority | 602 | 50.9 | |||
| Rejected ballots | 6 | 0.5 | |||
| Turnout | 1182 | 32.8 | |||
| Independent hold | Swing | ||||
2013 election
| Party | Candidate | Votes | % | ±% | |
|---|---|---|---|---|---|
| Independent | John Pollard | 716 | 65.0 | ||
| UKIP | Lynda Chidell | 260 | 23.6 | ||
| Labour | Anthony Phillips | 118 | 10.7 | ||
| Majority | 456 | 41.4 | |||
| Rejected ballots | 7 | 0.6 | |||
| Turnout | 1101 | 29.4 | |||
| Independent hold | Swing | ||||
2009 election
| Party | Candidate | Votes | % | ±% | |
|---|---|---|---|---|---|
| Independent | John Pollard | 653 | 50.4 | ||
| Conservative | Jeremy Joslin | 305 | 23.5 | ||
| Liberal Democrats | Robb Lello | 257 | 19.8 | ||
| Labour | Raymond Webber | 69 | 5.3 | ||
| Majority | 348 | 26.9 | |||
| Rejected ballots | 12 | 0.9 | |||
| Turnout | 1296 | 37.6 | |||
| Independent win (new seat) | |||||
2001 election
| Party | Candidate | Votes | % | ±% | |
|---|---|---|---|---|---|
| Liberal Democrats | T. Lello | 1,885 | 54.8 | ||
| Conservative | E. Penhaligon | 1,557 | 45.2 | ||
| Majority | 328 | 9.5 | |||
| Turnout | 3442 | 63.8 | |||
| Liberal Democrats hold | Swing | ||||
1997 election
| Party | Candidate | Votes | % | ±% | |
|---|---|---|---|---|---|
| Liberal Democrats | P. Batty | 1,136 | 31.0 | ||
| Independent | E. Penhaligon | 1,003 | 27.3 | ||
| Independent | C. Allen | 716 | 19.5 | ||
| Labour | T. Murray | 641 | 17.5 | ||
| Liberal | J. Farley | 172 | 4.7 | ||
| Majority | 133 | 3.6 | |||
| Turnout | 3668 | 71.5 | |||
| Liberal Democrats gain from Independent | Swing | ||||
1993 election
| Party | Candidate | Votes | % | ±% | |
|---|---|---|---|---|---|
| Independent | H. Johns | 1,165 | 67.8 | ||
| Conservative | J. Simmons | 553 | 32.2 | ||
| Majority | 612 | 35.6 | |||
| Turnout | 1718 | 33.0 | |||
| Independent hold | Swing | ||||
1989 election
| Party | Candidate | Votes | % | ±% | |
|---|---|---|---|---|---|
| Independent | H. Johns | 700 | 46.6 | ||
| Conservative | D. Jones | 461 | 30.7 | ||
| SDP | M. McGuire | 341 | 22.7 | ||
| Majority | 239 | 15.9 | |||
| Turnout | 1502 | 31.1 | |||
| Independent hold | Swing | ||||
1985 election
| Party | Candidate | Votes | % | ±% | |
|---|---|---|---|---|---|
| Independent | H. Johns | 733 | 55.6 | ||
| Conservative | M. Reynolds | 585 | 44.4 | ||
| Majority | 148 | 11.2 | |||
| Turnout | 1318 | 30.1 | |||
| Independent win (new seat) | |||||
References
- "Henwyn Tyller A-Z". Akademi Kernewek. Retrieved 23 August 2021.
- "E05 Electoral Ward/Division Hayle North E05009189". Office for National Statistics. Retrieved 23 August 2021.
- "E05 Electoral Ward/Division Hayle North E05008229". Office for National Statistics. Retrieved 23 August 2021.
- "Election results for Hayle North Cornwall Council elections - Thursday, 4th May, 2017". Cornwall Council. Retrieved 2 January 2021.
- "Election results for Hayle North Cornwall Council elections - Thursday, 2nd May, 2013". Cornwall Council. Retrieved 2 January 2021.
- "Election results for Hayle North Cornwall Council elections - Thursday, 4th June, 2009". Cornwall Council. Retrieved 2 January 2021.
- Colin Rallings; Michael Thrasher. "Cornwall County Council Election Results 1973-2005" (PDF). The Elections Centre. Plymouth University. Retrieved 1 January 2021.