List of Asian countries by population
This is a list of Asian countries and dependent territories by population sorted by normalised demographic projections.
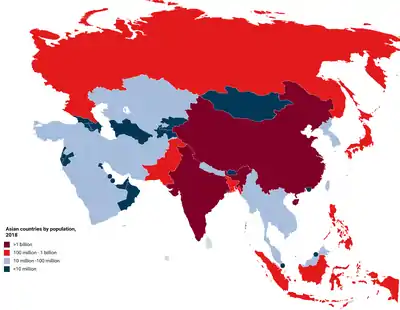
Asian countries by population, 2018
Table
| 1 |  China China | 1,387,160,730 | 31.35 | 0.49 | 6,730,000 | 141 | 1,411,778,724 | November 1, 2020 | Preliminary 2020 census result |
| 2 |  India India | 1,323,009,090 | 29.72 | 1.64 | 20,998,000 | 43 | 1,382,518,422 | September 30, 2021 | National Population Clock |
| 3 |  Indonesia Indonesia | 255,462,000 | 5.84 | 1.41 | 1,605,354 | 50 | 271,350,000 | December 31, 2020 | Official estimate |
| 4 |  Pakistan Pakistan | 202,785,000 | 4.39 | 2.40 | 3,765,000 | 35 | 225,200,000 | July 1, 2021 | UN Projection |
| 5 |  Bangladesh Bangladesh | 168,200,000 | 3.617 | 1.35 | 2,139,000 | 51 | 172,411,000 | December 16, 2021 | Official population clock |
| 6 |  Russia[1] Russia[1] | 144,031,000 | 3.19 | 0.19 | 278,000 | 368 | 146,171,015 | January 1, 2021 | Annual official estimate |
| 7 |  Japan Japan | 126,891,000 | 2.81 | -0.01 | -12,000 | - | 125,070,000 | November 1, 2021 | Monthly official estimate |
| 8 |  Philippines Philippines | 100,699,395 | 2.23 | 1.5 | 1,500,000 | 45 | 109,035,343 | May 1, 2021 | Official estimate |
| 9 |  Vietnam Vietnam | 96,208,984 | 2.03 | 1.16 | 1,057,000 | 60 | 97,580,000 | July 1, 2020 | Official estimate |
| 10 |  Iran Iran | 82,000,000 | 1.74 | 1.29 | 1,001,000 | 54 | 84,281,000 | December 16, 2021 | Official population clock |
| 11 |  Turkey Turkey | 78,214,000 | 1.73 | 1.34 | 1,035,000 | 52 | 83,614,362 | December 31, 2020 | Official estimate |
| 12 |  Thailand Thailand | 65,926,261 | 1.51 | 0.76 | 517,000 | 91 | 67,993,000 | July 1, 2019 | National Statistical Office |
| 13 |  Myanmar Myanmar | 51,486,253 | 1.26 | 1.22 | 632,000 | 57 | 54,101,253 | April 1, 2019 | National annual Projection |
| 14 |  South Korea South Korea | 50,617,000 | 1.12 | 0.38 | 193,000 | 181 | 51,671,569 | 1 July 2021 | Monthly National Estimate |
| 15 |  Iraq Iraq | 36,575,000 | 0.81 | 2.90 | 1,030,000 | 24 | 41,190,700 | July 1, 2021 | National Annual Projection |
| 16 |  Afghanistan Afghanistan | 31,523,418 | 0.70 | 2.44 | 751,000 | 29 | 40,218,234 | 2021 | Official estimate |
| 17 |  Uzbekistan Uzbekistan | 31,283,000 | 0.69 | 1.70 | 523,000 | 41 | 35,118,807 | September 30, 2021 | Official estimate |
| 18 |  Saudi Arabia Saudi Arabia | 26,849,000 | 0.59 | 1.87 | 494,000 | 37 | 35,013,414 | July 1, 2020 | Official estimate |
| 19 |  Malaysia Malaysia | 31,032,000 | 0.69 | 1.84 | 561,000 | 38 | 34,338,000 | December 16, 2021 | Official population clock |
| 20 |  Yemen Yemen | 26,745,000 | 0.59 | 2.95 | 766,000 | 24 | 30,491,000 | July 1, 2021 | Official estimate |
| 21 |  Nepal Nepal | 28,038,000 | 0.62 | 1.42 | 392,000 | 49 | 30,378,055 | July 1, 2021 | Official estimate |
| 22 |  North Korea North Korea | 25,180,000 | 0.57 | 1.08 | 277,000 | 64 | 25,660,000 | July 1, 2021 | National Annual Projection |
| 23 |  Taiwan Taiwan | 23,455,000 | 0.52 | 0.35 | 81,000 | 200 | 23,476,640 | October 31, 2015 | Monthly official estimate |
| 24 |  Sri Lanka Sri Lanka | 22,480,000 | 0.51 | 0.94 | 194,000 | 74 | 22,480,000 | February 19, 2017 | Live Population |
| 25 |  Kazakhstan Kazakhstan | 18,906,000 | 0.42 | 2.45 | 557,000 | 29 | 21,377,000 | December 31, 2011 | Official estimate |
| 26 |  Syria Syria | 17,541,000 | 0.39 | 1.45 | 250,000 | 48 | 18,276,000 | July 1 ,2021 | Monthly official estimate |
| 27 |  Cambodia Cambodia | 15,040,000 | 0.33 | 1.59 | 236,000 | 44 | 15,552,211 | March 3, 2019 | 2019 census result |
| 28 |  Jordan Jordan | 6,837,000 | 0.15 | 2.75 | 183,000 | 26 | 11,051,940 | October 10, 2021 | Official estimate |
| 29 |  Azerbaijan Azerbaijan | 9,651,000 | 0.21 | 1.23 | 117,000 | 57 | 10,139,196 | July 1,2021 | Official estimate |
| 30 |  Tajikistan Tajikistan | 8,454,000 | 0.19 | 2.35 | 194,000 | 30 | 9,504,000 | January 1, 2021 | Official estimate |
| 31 |  United Arab Emirates United Arab Emirates | 8,933,000 | 0.20 | 1.57 | 138,000 | 45 | 9,503,738 | December 31, 2019 | Official estimate |
| 32 |  Israel Israel | 8,372,000 | 0.19 | 1.89 | 155,000 | 37 | 9,412,700 | October 10, 2021 | Monthly official estimate |
| 33 |  Hong Kong[2] Hong Kong[2] | 7,299,000 | 0.16 | 0.90 | 65,000 | 77 | 7,500,700 | May 29,2020 | Official estimate |
| 34 |  Lebanon Lebanon | 4,288,000 | 0.09 | 1.78 | 75,000 | 39 | 6,769,000 | July 1,2021 | Official estimate |
| 34 |  Kyrgyzstan Kyrgyzstan | 6,543,000 | 0.13 | 1.64 | 96,000 | 43 | 5,895,100 | January 1, 2015 | Official estimate |
| 35 |  Laos Laos | 6,202,000 | 0.15 | 1.63 | 109,000 | 43 | 6,492,400 | March 1, 2015 | Preliminary 2015 census result |
| 36 |  Singapore Singapore | 5,541,000 | 0.12 | 1.30 | 71,000 | 54 | 5,535,000 | July 1, 2015 | Official estimate |
| 37 |  Turkmenistan Turkmenistan | 5,302,000 | 0.11 | 1.24 | 60,000 | 56 | 4,751,120 | December 26, 2012 | 2012 census result |
| 38 |  Palestine[3] Palestine[3] | 4,683,000 | 0.10 | 2.92 | 133,000 | 24 | 4,550,368 | 2014 | Official estimate |
| 39 |  Oman Oman | 4,181,000 | 0.09 | 5.13 | 204,000 | 14 | 4,683,500 | December 16, 2021 | Official population clock |
| 40 |  Kuwait Kuwait | 4,161,000 | 0.09 | 3.00 | 121,000 | 23 | 4,183,658 | June 30, 2015 | Official estimate |
| 41 |  Georgia Georgia | 3,730,000 | 0.08 | 0.03 | 1,000 | 2,585 | 3,729,500 | January 1, 2015 | Official estimate |
| 42 |  Mongolia Mongolia | 3,029,000 | 0.08 | 2.19 | 65,000 | 32 | 3,361,300 | December 16, 2021 | Official population clock |
| 43 |  Armenia Armenia | 3,005,000 | 0.07 | -0.03 | -1,000 | - | 3,004,000 | September 30, 2015 | Monthly official estimate |
| 44 |  Qatar Qatar | 2,113,000 | 0.05 | 4.29 | 87,000 | 16 | 2,412,483 | October 31, 2015 | Monthly official estimate |
| 45 |  Timor-Leste (East Timor) Timor-Leste (East Timor) | 1,645,000 | 0.03 | 2.72 | 33,000 | 26 | 1,167,242 | July 11, 2015 | Preliminary 2015 census result |
| 46 |  Bahrain Bahrain | 1,381,000 | 0.04 | 7.35 | 122,000 | 10 | 1,501,635 | February 28, 2021 | Bahrain 2020 Census |
| 47 |  Bhutan Bhutan | 760,000 | 0.02 | 1.74 | 13,000 | 40 | 854,720 | December 16, 2021 | Official population clock |
| 48 |  Macau[4] Macau[4] | 641,000 | 0.01 | 3.89 | 24,000 | 18 | 643,100 | September 2015 | Official estimate |
49 |  Maldives Maldives | 454,914 | 0.01 | 1.47 | 5,000 | 47 | 557,426 | January 14, 2021 | National Bureau of Statistics |
| 50 |  Brunei Brunei | 421,000 | 0.01 | 1.69 | 7,000 | 41 | 460,345 | July 1, 2020 | National Annual Estimate |
| Total 48 countries | 4,525,817,000 | 100.00 | 1.16 | 52,210,000 | 58 |
Asian population by country (top 8).
China (31.35%)
India (29.72%)
Indonesia (5.84%)
Pakistan (4.39%)
Bangladesh (3.63%)
Russia (3.19%)
Japan (2.81%)
Philippines (2.28%)
Other (16.79%)
See also
- List of Asian countries by area
- List of countries by population
- List of African countries by population
- List of countries in the Americas by population
- List of Arab countries by population
- List of Asian countries by population growth rate
- List of Caribbean island countries by population
- List of Eurasian countries by population
- List of European countries by population
- List of European Union member states by population
- List of Latin American countries by population
- List of member states of the Commonwealth of Nations by population
- List of Middle East countries by population
- List of North American countries by population
- List of Oceanian countries by population
- List of South American countries by population
- List of countries by past and future population
- List of countries by population in 2000
- List of countries by population in 2010
- List of population concern organizations
References
- The mid-2015 demographic projection excludes the disputed territory of the Republic of Crimea and the city of Sevastopol (the so-called Crimean Federal District), although the Russian official estimate includes both of them.
- Special Administrative Region (SAR): Former British colony, it definitely reverted to Chinese sovereignty on July 1, 1997.
- It comprises the Gaza Strip and the West Bank, separated between each other by an Israeli land corridor.
- Special Administrative Region (SAR): Former Portuguese colony, it reverted to Chinese sovereignty on December 20, 1999.
This article is issued from Wikipedia. The text is licensed under Creative Commons - Attribution - Sharealike. Additional terms may apply for the media files.