Alabama statistical areas

The U.S. State of Alabama currently has 36 statistical areas that have been delineated by the Office of Management and Budget (OMB). On March 6, 2020, the OMB delineated nine combined statistical areas, 13 metropolitan statistical areas, and 14 micropolitan statistical areas in Alabama.[1]
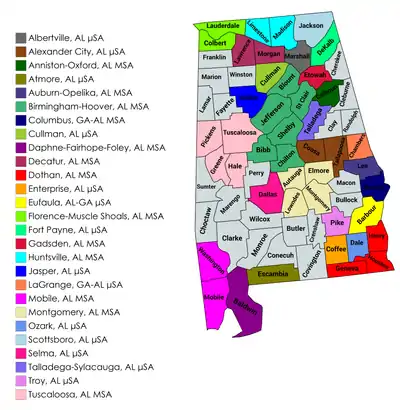
An enlargeable map of the 27 core-based statistical areas in Alabama.[1]

Statistical areas

The Office of Management and Budget (OMB) has designated more than 1,000 statistical areas for the United States and Puerto Rico.[2] These statistical areas are important geographic delineations of population clusters used by the OMB, the United States Census Bureau, planning organizations, and federal, state, and local government entities.

The OMB defines a core-based statistical area (commonly referred to as a CBSA) as "a statistical geographic entity consisting of the county or counties (or county-equivalents) associated with at least one core[lower-alpha 1] of at least 10,000 population, plus adjacent counties having a high degree of social and economic integration with the core as measured through commuting ties with the counties containing the core."[2] The OMB further divides core-based statistical areas into metropolitan statistical areas (MSAs) that have "a population of at least 50,000" and micropolitan statistical areas (μSAs) that have "a population of at least 10,000, but less than 50,000."[2]

The OMB defines a combined statistical area (CSA) as "a geographic entity consisting of two or more adjacent core-based statistical areas with employment interchange measures[lower-alpha 2] of at least 15%."[2] The primary statistical areas (PSAs) include all combined statistical areas and any core-based statistical area that is not a constituent of a combined statistical area.

Table

The table below describes the 36 United States statistical areas and 67 counties of the State of Alabama with the following information:[3]

  1. The combined statistical area (CSA) as designated by the OMB.[1]
  2. The CSA population according to 2019 US Census Bureau population estimates.[4]
  3. The core based statistical area (CBSA)[2] as designated by the OMB.[1]
  4. The CBSA population according to 2019 US Census Bureau population estimates [4]
  5. The county name
  6. The county population according to 2019 US Census Bureau population estimates [4]
The 36 United States statistical areas and 67 counties of the State of Alabama

Combined Statistical Area 2019 Population Core Based Statistical Area 2019 Population County 2019 Population
Birmingham-Hoover-Talladega, AL CSA 1,317,702 Birmingham-Hoover, AL MSA 1,090,435 Jefferson County, Alabama 658,573
Shelby County, Alabama 217,702
St. Clair County, Alabama 89,512
Blount County, Alabama 57,826
Chilton County, Alabama 44,428
Bibb County, Alabama 22,394
Cullman, AL μSA 83,768 Cullman County, Alabama 83,768
Talladega-Sylacauga, AL μSA 79,978 Talladega County, Alabama 79,978
Jasper, AL μSA 63,521 Walker County, Alabama 63,521
Mobile-Daphne-Fairhope, AL CSA 652,770 Mobile, AL MSA 429,536 Mobile County, Alabama 413,210
Washington County, Alabama 16,326
Daphne-Fairhope-Foley, AL MSA 223,234 Baldwin County, Alabama 223,234
Huntsville-Decatur, AL CSA 624,427 Huntsville, AL MSA 471,824 Madison County, Alabama 372,909
Limestone County, Alabama 98,915
Decatur, AL MSA 119,679 Morgan County, Alabama 119,679
Lawrence County, Alabama 32,924
Montgomery-Alexander City-Selma, AL CSA 461,516 Montgomery, AL MSA 373,290 Montgomery County, Alabama 226,486
Elmore County, Alabama 81,209
Autauga County, Alabama 55,869
Lowndes County, Alabama 9,726
Alexander City, AL μSA 51,030 Tallapoosa County, Alabama 40,367
Coosa County, Alabama 10,663
Selma, AL μSA 37,196 Dallas County, Alabama 37,196
none Tuscaloosa, AL MSA 252,047 Tuscaloosa County, Alabama 209,355
Pickens County, Alabama 19,930
Hale County, Alabama 14,651
Greene County, Alabama 8,111
Columbus-Auburn-Opelika, GA-AL CSA 485,590
222,503
Columbus, GA-AL MSA 321,048
57,961
Muscogee County, Georgia 195,769
Russell County, Alabama 57,961
Harris County, Georgia 35,236
Chattahoochee County, Georgia 10,907
Marion County, Georgia 8,359
Stewart County, Georgia 6,621
Talbot County, Georgia 6,195
Auburn-Opelika, AL MSA 164,542 Lee County, Alabama 164,542
Dothan-Ozark, AL CSA 198,530 Dothan, AL MSA 140,358 Houston County, Alabama 105,882
Geneva County, Alabama 26,271
Henry County, Alabama 17,205
Ozark, AL μSA 49,172 Dale County, Alabama 49,172
none Florence-Muscle Shoals, AL MSA 149,358 Lauderdale County, Alabama 92,729
Colbert County, Alabama 55,241
Scottsboro-Fort Payne, AL CSA 123,139 Fort Payne, AL μSA 71,513 DeKalb County, Alabama 71,513
Scottsboro, AL μSA 51,626 Jackson County, Alabama 51,626
none Anniston-Oxford, AL MSA 113,605 Calhoun County, Alabama 113,605
Gadsden, AL MSA 102,268 Etowah County, Alabama 102,268
Albertville, AL μSA 96,774 Marshall County, Alabama 96,774
Enterprise, AL μSA 52,342 Coffee County, Alabama 52,342
Pensacola-Ferry Pass, FL-AL CSA 539,292
36,663
Pensacola-Ferry Pass-Brent, FL MSA 502,629 Escambia County, Florida 318,316
Santa Rosa County, Florida 184,313
Atmore, AL μSA 36,663 Escambia County, Alabama 36,663
Atlanta--Athens-Clarke County--Sandy Springs, GA-AL CSA 6,853,392
33,254
Atlanta-Sandy Springs-Alpharetta, GA MSA 6,020,364 Fulton County, Georgia 1,063,937
Gwinnett County, Georgia 936,250
Cobb County, Georgia 760,141
DeKalb County, Georgia 759,297
Clayton County, Georgia 292,256
Cherokee County, Georgia 258,773
Forsyth County, Georgia 244,252
Henry County, Georgia 234,561
Paulding County, Georgia 168,667
Coweta County, Georgia 148,509
Douglas County, Georgia 146,343
Carroll County, Georgia 119,992
Fayette County, Georgia 114,421
Newton County, Georgia 111,744
Bartow County, Georgia 107,738
Walton County, Georgia 94,593
Rockdale County, Georgia 90,896
Barrow County, Georgia 83,240
Spalding County, Georgia 66,703
Pickens County, Georgia 32,591
Haralson County, Georgia 29,792
Dawson County, Georgia 26,108
Butts County, Georgia 24,936
Meriwether County, Georgia 21,167
Morgan County, Georgia 19,276
Lamar County, Georgia 19,077
Pike County, Georgia 18,962
Jasper County, Georgia 14,219
Heard County, Georgia 11,923
Athens-Clarke County, GA MSA 213,750 Clarke County, Georgia 128,331
Oconee County, Georgia 40,280
Madison County, Georgia 29,880
Oglethorpe County, Georgia 15,259
Gainesville, GA MSA 204,441 Hall County, Georgia 204,441
LaGrange, GA-AL μSA 103,176
33,254
Troup County, Georgia 69,922
Chambers County, Alabama 33,254
Rome, GA MSA 98,498 Floyd County, Georgia 98,498
Jefferson, GA μSA 72,977 Jackson County, Georgia 72,977
Cornelia, GA μSA 45,328 Habersham County, Georgia 45,328
Cedartown, GA μSA 42,613 Polk County, Georgia 42,613
Thomaston, GA μSA 26,320 Upson County, Georgia 26,320
Toccoa, GA μSA 25,925 Stephens County, Georgia 25,925
none Troy, AL μSA 33,114 Pike County, Alabama 33,114
Eufaula, AL-GA μSA 26,985
24,686
Barbour County, Alabama 24,686
Quitman County, Georgia 2,299
none Covington County, Alabama 37,049
Franklin County, Alabama 31,362
Marion County, Alabama 29,709
Cherokee County, Alabama 26,196
Winston County, Alabama 23,629
Clarke County, Alabama 23,622
Randolph County, Alabama 22,722
Monroe County, Alabama 20,733
Butler County, Alabama 19,448
Marengo County, Alabama 18,863
Macon County, Alabama 18,068
Fayette County, Alabama 16,302
Cleburne County, Alabama 14,910
Lamar County, Alabama 13,805
Crenshaw County, Alabama 13,772
Clay County, Alabama 13,235
Choctaw County, Alabama 12,589
Sumter County, Alabama 12,427
Conecuh County, Alabama 12,067
Wilcox County, Alabama 10,373
Bullock County, Alabama 10,101
Perry County, Alabama 8,923
State of Alabama 4,905,514

See also

Notes

  1. The OMB defines a core as "a densely settled concentration of population, comprising an Urban Area (of 10,000 or more population) delineated by the Census Bureau, around which a core-based statistical area is delineated."[2]
  2. The OMB defines the employment interchange measure as "the sum of the percentage of workers living in the smaller entity who work in the larger entity plus the percentage of employment in the smaller entity that is accounted for by workers who reside in the larger entity."[2]

References

  1. Revised Delineations of Metropolitan Statistical Areas, Micropolitan Statistical Areas, and Combined Statistical Areas, and Guidance on Uses of the Delineations of These Areas (March 6, 2020). "0MB BULLETIN NO. 20-01" (PDF). Office of Management and Budget. Retrieved December 6, 2021.CS1 maint: multiple names: authors list (link)
  2. "2020 Standards for Delineating Core Based Statistical Areas". Office of Management and Budget. July 16, 2021. Retrieved December 6, 2021.
  3. An out-of-state area and its population are displayed in green. An area that extends into more than one state is displayed in teal. A teal population number over a black population number show the total population versus the in-state population.
  4. "Annual Estimates of the Resident Population for Counties in the United States: April 1, 2010 to July 1, 2019". United States Census Bureau, Population Division. April 2020. Retrieved April 9, 2020.


This article is issued from Wikipedia. The text is licensed under Creative Commons - Attribution - Sharealike. Additional terms may apply for the media files.