Nevada statistical areas
The U.S. State of Nevada currently has 11 statistical areas that have been delineated by the Office of Management and Budget (OMB). On March 6, 2020, the OMB delineated two combined statistical areas, three metropolitan statistical areas, and six micropolitan statistical areas in Nevada.[1]
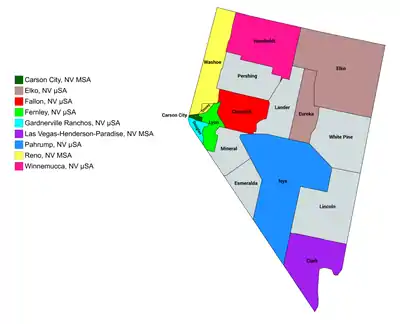
Statistical areas
The Office of Management and Budget (OMB) has designated more than 1,000 statistical areas for the United States and Puerto Rico.[2] These statistical areas are important geographic delineations of population clusters used by the OMB, the United States Census Bureau, planning organizations, and federal, state, and local government entities.
The OMB defines a core-based statistical area (commonly referred to as a CBSA) as "a statistical geographic entity consisting of the county or counties (or county-equivalents) associated with at least one core[lower-alpha 1] of at least 10,000 population, plus adjacent counties having a high degree of social and economic integration with the core as measured through commuting ties with the counties containing the core."[2] The OMB further divides core-based statistical areas into metropolitan statistical areas (MSAs) that have "a population of at least 50,000" and micropolitan statistical areas (μSAs) that have "a population of at least 10,000, but less than 50,000."[2]
The OMB defines a combined statistical area (CSA) as "a geographic entity consisting of two or more adjacent core-based statistical areas with employment interchange measures[lower-alpha 2] of at least 15%."[2] The primary statistical areas (PSAs) include all combined statistical areas and any core-based statistical area that is not a constituent of a combined statistical area.
Table
The table below describes the 11 United States statistical areas, 16 counties, and 1 independent city of the State of Nevada with the following information:[3]
- The combined statistical area (CSA) as designated by the OMB.[1]
- The CSA population according to 2019 US Census Bureau population estimates.[4]
- The core based statistical area (CBSA)[2] as designated by the OMB.[1]
- The CBSA population according to 2019 US Census Bureau population estimates [4]
- The county name
- The county population according to 2019 US Census Bureau population estimates [4]
Notes
- The OMB defines a core as "a densely settled concentration of population, comprising an Urban Area (of 10,000 or more population) delineated by the Census Bureau, around which a core-based statistical area is delineated."[2]
- The OMB defines the employment interchange measure as "the sum of the percentage of workers living in the smaller entity who work in the larger entity plus the percentage of employment in the smaller entity that is accounted for by workers who reside in the larger entity."[2]
References
- Revised Delineations of Metropolitan Statistical Areas, Micropolitan Statistical Areas, and Combined Statistical Areas, and Guidance on Uses of the Delineations of These Areas (March 6, 2020). "0MB BULLETIN NO. 20-01" (PDF). Office of Management and Budget. Retrieved December 15, 2021.CS1 maint: multiple names: authors list (link)
- "2020 Standards for Delineating Core Based Statistical Areas". Office of Management and Budget. July 16, 2021. Retrieved December 15, 2021.
- An out-of-state area and its population are displayed in green. An area that extends into more than one state is displayed in teal. A teal population number over a black population number show the total population versus the in-state population.
- "Annual Estimates of the Resident Population for Counties in the United States: April 1, 2010 to July 1, 2019". United States Census Bureau, Population Division. April 2020. Retrieved April 9, 2020.