California statistical areas

The U.S. State of California currently has 39 statistical areas that have been delineated by the Office of Management and Budget (OMB). On March 6, 2020, the OMB delineated five combined statistical areas, 26 metropolitan statistical areas, and eight micropolitan statistical areas in California.[1]
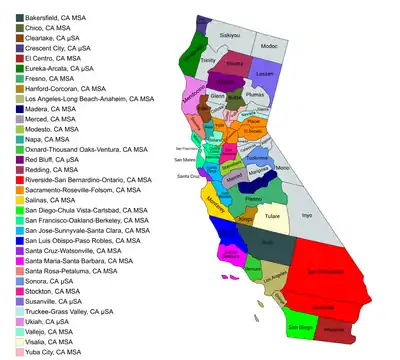
An enlargeable map of the 34 core-based statistical areas in California.[1]

Statistical areas

The Office of Management and Budget (OMB) has designated more than 1,000 statistical areas for the United States and Puerto Rico.[2] These statistical areas are important geographic delineations of population clusters used by the OMB, the United States Census Bureau, planning organizations, and federal, state, and local government entities.

The OMB defines a core-based statistical area (commonly referred to as a CBSA) as "a statistical geographic entity consisting of the county or counties (or county-equivalents) associated with at least one core[lower-alpha 1] of at least 10,000 population, plus adjacent counties having a high degree of social and economic integration with the core as measured through commuting ties with the counties containing the core."[2] The OMB further divides core-based statistical areas into metropolitan statistical areas (MSAs) that have "a population of at least 50,000" and micropolitan statistical areas (μSAs) that have "a population of at least 10,000, but less than 50,000."[2]

The OMB defines a combined statistical area (CSA) as "a geographic entity consisting of two or more adjacent core-based statistical areas with employment interchange measures[lower-alpha 2] of at least 15%."[2] The primary statistical areas (PSAs) include all combined statistical areas and any core-based statistical area that is not a constituent of a combined statistical area.

Table

The table below describes the 39 United States statistical areas and 58 counties of the State of California with the following information:[3]

  1. The combined statistical area (CSA) as designated by the OMB.[1]
  2. The CSA population according to 2019 US Census Bureau population estimates.[4]
  3. The core based statistical area (CBSA)[2] as designated by the OMB.[1]
  4. The CBSA population according to 2019 US Census Bureau population estimates [4]
  5. The county name
  6. The county population according to 2019 US Census Bureau population estimates [4]
  7. The Metropolitan Division name, if applicable[1]
  8. The Metropolitan Division population according to 2019 US Census Bureau population estimates [4]
The 39 United States statistical areas and 58 counties of the State of California

Combined Statistical Area 2019 Population Core Based Statistical Area 2019 Population County 2019 Population Metropolitan Division 2019 Population
Los Angeles-Long Beach, CA CSA 18,711,436 Los Angeles-Long Beach-Anaheim, CA MSA 13,214,799 Los Angeles County, California 10,039,107 Los Angeles-Long Beach-Glendale, CA MD 10,039,107
Orange County, California 3,175,692 Anaheim-Santa Ana-Irvine, CA MD 3,175,692
Riverside-San Bernardino-Ontario, CA MSA 4,650,631 Riverside County, California 2,470,546 none
San Bernardino County, California 2,180,085
Oxnard-Thousand Oaks-Ventura, CA MSA 846,006 Ventura County, California 846,006
San Jose-San Francisco-Oakland, CA CSA 9,665,887 San Francisco-Oakland-Berkeley, CA MSA 4,731,803 Alameda County, California 1,671,329 Oakland-Berkeley-Livermore, CA MD 2,824,855
Contra Costa County, California 1,153,526
San Francisco County, California 881,549 San Francisco-San Mateo-Redwood City, CA MD 1,648,122
San Mateo County, California 766,573
Marin County, California 258,826 San Rafael, CA MD 258,826
San Jose-Sunnyvale-Santa Clara, CA MSA 1,990,660 Santa Clara County, California 1,927,852 none
San Benito County, California 62,808
Stockton, CA MSA 762,148 San Joaquin County, California 762,148
Modesto, CA MSA 550,660 Stanislaus County, California 550,660
Santa Rosa-Petaluma, CA MSA 494,336 Sonoma County, California 494,336
Vallejo, CA MSA 447,643 Solano County, California 447,643
Merced, CA MSA 277,680 Merced County, California 277,680
Santa Cruz-Watsonville, CA MSA 273,213 Santa Cruz County, California 273,213
Napa, CA MSA 137,744 Napa County, California 137,744
none San Diego-Chula Vista-Carlsbad, CA MSA 3,338,330 San Diego County, California 3,338,330
Sacramento-Roseville, CA CSA 2,639,124 Sacramento-Roseville-Folsom, CA MSA 2,363,730 Sacramento County, California 1,552,058
Placer County, California 398,329
Yolo County, California 220,500
El Dorado County, California 192,843
Yuba City, CA MSA 175,639 Sutter County, California 96,971
Yuba County, California 78,668
Truckee-Grass Valley, CA μSA 99,755 Nevada County, California 99,755
Fresno-Madera-Hanford, CA CSA 1,309,368 Fresno, CA MSA 999,101 Fresno County, California 999,101
Madera, CA MSA 157,327 Madera County, California 157,327
Hanford-Corcoran, CA MSA 152,940 Kings County, California 152,940
none Bakersfield, CA MSA 900,202 Kern County, California 900,202
Visalia, CA MSA 466,195 Tulare County, California 466,195
Santa Maria-Santa Barbara, CA MSA 446,499 Santa Barbara County, California 446,499
Salinas, CA MSA 434,061 Monterey County, California 434,061
San Luis Obispo-Paso Robles, CA MSA 283,111 San Luis Obispo County, California 283,111
Redding-Red Bluff, CA CSA 245,164 Redding, CA MSA 180,080 Shasta County, California 180,040
Red Bluff, CA μSA 65,084 Tehama County, California 65,084
none Chico, CA MSA 219,186 Butte County, California 219,186
El Centro, CA MSA 181,215 Imperial County, California 181,215
Eureka-Arcata, CA μSA 135,558 Humboldt County, California 135,558
Ukiah, CA μSA 86,749 Mendocino County, California 86,749
Clearlake, CA μSA 64,386 Lake County, California 64,386
Sonora, CA μSA 54,478 Tuolumne County, California 54,478
Susanville, CA μSA 30,573 Lassen County, California 30,573
Crescent City, CA μSA 27,812 Del Norte County, California 27,812
none Calaveras County, California 45,905
Siskiyou County, California 43,439
Amador County, California 39,752
Glenn County, California 28,393
Colusa County, California 21,547
Plumas County, California 18,807
Inyo County, California 18,039
Mariposa County, California 17,203
Mono County, California 14,444
Trinity County, California 12,285
Modoc County, California 8,841
Sierra County, California 3,005
Alpine County, California 1,129
State of California 39,512,123

See also

Notes

  1. The OMB defines a core as "a densely settled concentration of population, comprising an Urban Area (of 10,000 or more population) delineated by the Census Bureau, around which a core-based statistical area is delineated."[2]
  2. The OMB defines the employment interchange measure as "the sum of the percentage of workers living in the smaller entity who work in the larger entity plus the percentage of employment in the smaller entity that is accounted for by workers who reside in the larger entity."[2]

References

  1. Revised Delineations of Metropolitan Statistical Areas, Micropolitan Statistical Areas, and Combined Statistical Areas, and Guidance on Uses of the Delineations of These Areas (March 6, 2020). "0MB BULLETIN NO. 20-01" (PDF). Office of Management and Budget. Retrieved December 6, 2021.CS1 maint: multiple names: authors list (link)
  2. "2020 Standards for Delineating Core Based Statistical Areas". Office of Management and Budget. July 16, 2021. Retrieved December 6, 2021.
  3. An out-of-state area and its population are displayed in green. An area that extends into more than one state is displayed in teal. A teal population number over a black population number show the total population versus the in-state population.
  4. "Annual Estimates of the Resident Population for Counties in the United States: April 1, 2010 to July 1, 2019". United States Census Bureau, Population Division. April 2020. Archived from the original on March 27, 2020. Retrieved April 9, 2020.
This article is issued from Wikipedia. The text is licensed under Creative Commons - Attribution - Sharealike. Additional terms may apply for the media files.