Kings West
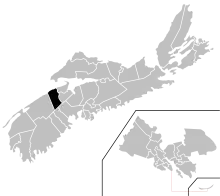
Kings West is a provincial electoral district in Nova Scotia, Canada, that elects one member of the Nova Scotia House of Assembly. It includes the towns of Berwick and Kingston, and the village of Greenwood.
 Nova Scotia electoral district Nova Scotia electoral district | |||
|---|---|---|---|
 | |||
| Provincial electoral district | |||
| Legislature | Nova Scotia House of Assembly | ||
| MLA |
Progressive Conservative | ||
| District created | 1956 | ||
| Last contested | 2021 | ||
| Demographics | |||
| Population (2011) | 19,495 | ||
| Electors | 15,019 | ||
| Area (km²) | 1,143 | ||
| Pop. density (per km²) | 17.1 | ||
| Census division(s) | Kings County | ||
Geography
The electoral district of Kings West has 1,143 km2 (441 sq mi) of land area.[1]
Members of the Legislative Assembly
This riding has elected the following Members of the Legislative Assembly:
| Legislature | Years | Member | Party | |
|---|---|---|---|---|
| 46th | 1956-1960 | Hiram Thomas | Progressive Conservative | |
| 47th | 1960-1963 | Edward D. MacArthur | Liberal | |
| 48th | 1963-1967 | Paul Kinsman | Progressive Conservative | |
| 49th | 1967-1970 | Gordon Tidman | Progressive Conservative | |
| 50th | 1970-1971 | |||
| 1971-1974 | Frank Bezanson | Liberal | ||
| 51st | 1974-1978 | |||
| 52nd | 1978-1981 | George Moody | Progressive Conservative | |
| 53rd | 1981-1984 | |||
| 54th | 1984-1988 | |||
| 55th | 1988-1993 | |||
| 56th | 1993-1998 | |||
| 57th | 1998-1999 | |||
| 58th | 1999-2003 | Jon Carey | Progressive Conservative | |
| 59th | 2003-2006 | Leo Glavine | Liberal | |
| 60th | 2006-2009 | |||
| 61st | 2009–2013 | |||
| 62nd | 2013–2017 | |||
| 63rd | 2017–2021 | |||
| 64th | 2021-present | Chris Palmer | Progressive Conservative | |
Election results
1999 general election
| Party | Candidate | Votes | % | ±% | |
|---|---|---|---|---|---|
| Progressive Conservative | Jon Carey | 4,033 | 49.34 | ||
| Liberal | Don Clarke | 2,346 | 28.70 | ||
| New Democratic Party | Jacquie DeMestral | 1,629 | 19.93 | ||
| Nova Scotia Party | Frances Adams | 166 | 2.03 | ||
2003 general election
| Party | Candidate | Votes | % | ±% | |
|---|---|---|---|---|---|
| Liberal | Leo Glavine | 3,045 | 36.91 | ||
| Progressive Conservative | Jon Carey | 2,935 | 35.58 | ||
| New Democratic Party | Greg Hubbert | 2,269 | 27.51 | ||
2006 general election
| Party | Candidate | Votes | % | ±% | |
|---|---|---|---|---|---|
| Liberal | Leo Glavine | 3,940 | 46.67 | ||
| Progressive Conservative | John Prall | 2,801 | 33.18 | ||
| New Democratic Party | Greg Hubbert | 1,590 | 18.83 | ||
| Green | Nistal Prem de Boer | 112 | 1.33 | – | |
2009 general election
| Party | Candidate | Votes | % | ±% | |
|---|---|---|---|---|---|
| Liberal | Leo Glavine | 4,996 | 60.85 | ||
| Progressive Conservative | Chris Palmer | 1,668 | 20.31 | ||
| New Democratic Party | Carol Tobin | 1,398 | 17.03 | ||
| Green | Nistal Prem de Boer | 149 | 1.81 | – | |
2013 general election
| Party | Candidate | Votes | % | ±% | |
|---|---|---|---|---|---|
| Liberal | Leo Glavine | 5,890 | 74.31 | +13.46 | |
| Progressive Conservative | Jody Alan Frowley | 1,275 | 16.09 | -4.22 | |
| New Democratic Party | Robert K. (Bob) Landry | 603 | 7.61 | -9.42 | |
| Green | Barbara G. Lake | 158 | 1.99 | +0.18 | |
2017 general election
| 2017 provincial election redistributed results[2] | |||
|---|---|---|---|
| Party | Vote | % | |
| Liberal | 4,559 | 52.06 | |
| Progressive Conservative | 3,255 | 37.17 | |
| New Democratic | 653 | 7.46 | |
| Green | 270 | 3.08 | |
| Atlantica | 21 | 0.24 | |
| 2017 Nova Scotia general election | ||||||||
|---|---|---|---|---|---|---|---|---|
| Party | Candidate | Votes | % | ±% | ||||
| Liberal | Leo Glavine | 4,190 | 52.45 | -21.86 | ||||
| Progressive Conservative | Chris Palmer | 3,015 | 37.74 | +21.65 | ||||
| New Democratic | Cheryl Burbidge | 536 | 6.71 | -0.90 | ||||
| Green | Madeline Taylor | 247 | 3.09 | +1.10 | ||||
| Total valid votes | 7,988 | 100 | ||||||
| Total rejected ballots | 18 | 0.22 | ||||||
| Turnout | 8,006 | 53.30 | ||||||
| Eligible voters | 15,019 | |||||||
| Liberal hold | Swing | -21.76 | ||||||
| Source: Elections Nova Scotia[3][4] | ||||||||
2021 general election
| 2021 Nova Scotia general election | ||||||||
|---|---|---|---|---|---|---|---|---|
| Party | Candidate | Votes | % | ±% | ||||
| Progressive Conservative | Chris Palmer | 4,592 | 49.45 | +12.28 | ||||
| Liberal | Emily Lutz | 3,856 | 41.52 | -10.53 | ||||
| New Democratic | Jason Langille | 549 | 5.91 | -1.54 | ||||
| Green | Sue Earle | 216 | 2.33 | -0.76 | ||||
| Atlantica | Rick Mehta | 74 | 0.79 | +0.55 | ||||
| Total valid votes | 9,287 | 99.73 | ||||||
| Total rejected ballots | 25 | 0.27 | ||||||
| Turnout | 9,312 | 56.65 | ||||||
| Eligible voters | 16,439 | |||||||
| Progressive Conservative gain from Liberal | Swing | +11.41 | ||||||
| Source: Elections Nova Scotia[5] | ||||||||
References
- "Find Your Electoral District for the 41st Provincial General Election". enstools.electionsnovascotia.ca. Elections Nova Scotia. Retrieved 22 July 2021.
- Transposition of Votes from the 2017 Provincial General Election to 2019 Electoral District Boundaries
- "Statement of Votes & Statistics, Volume I" (PDF). Elections Nova Scotia. Retrieved July 17, 2021.
- "May 30th, 2017 - 40th Nova Scotia Provincial General Election". Elections Nova Scotia. Retrieved July 17, 2021.
- "Provincial General Election 2021-08-17- Official Results". Elections Nova Scotia. Retrieved October 7, 2021.
This article is issued from Wikipedia. The text is licensed under Creative Commons - Attribution - Sharealike. Additional terms may apply for the media files.