Lunenburg (provincial electoral district)
Lunenburg is a provincial electoral district in Nova Scotia, Canada, that elects one member of the Nova Scotia House of Assembly.
 Nova Scotia electoral district Nova Scotia electoral district | |||
|---|---|---|---|
 | |||
| Provincial electoral district | |||
| Legislature | Nova Scotia House of Assembly | ||
| MLA |
Progressive Conservative | ||
| District created | 1867 | ||
| First contested | 1867 | ||
| Last contested | 2021 | ||
| Demographics | |||
| Population (2011) | 17,053 | ||
| Electors (2012) | 14,140 | ||
| Area (km²) | 894 | ||
| Pop. density (per km²) | 19.1 | ||
| Census division(s) | Lunenburg | ||
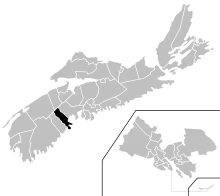
From 1867 to 1956, the district included all of Lunenburg County.[1] In 1956, the district was abolished into Lunenburg Centre, Lunenburg East and Lunenburg West. The riding was re-created in 1993 with nearly identical boundaries to Lunenburg Centre, except it lost the area west of the LaHave River (except New Germany) to Lunenburg West. The district also lost the Tancook Islands to Chester-St. Margaret's.
The riding includes the towns of Lunenburg and Mahone Bay.[1]
Geography
Lunenburg electoral district covers 894 km2 (345 sq mi) of land area.[2]
Members of the Legislative Assembly
This riding has elected the following Members of the Legislative Assembly:
Election results
2021 general election
| 2021 Nova Scotia general election | ||||||||
|---|---|---|---|---|---|---|---|---|
| Party | Candidate | Votes | % | ±% | ||||
| Progressive Conservative | Susan Corkum-Greek | 3,544 | 42.01 | +11.10 | ||||
| Liberal | Suzanne Lohnes-Croft | 2,915 | 34.55 | -4.93 | ||||
| New Democratic | Alison Smith | 1,750 | 20.74 | -8.86 | ||||
| Green | Thomas Trappenberg | 171 | 2.03 | +2.02 | ||||
| Atlantica | John Giannakos | 57 | 0.67 | |||||
| Total valid votes | 8,437 | 99.69 | ||||||
| Total rejected ballots | 26 | 0.31 | ||||||
| Turnout | 8,463 | 58.14 | ||||||
| Eligible voters | 14,555 | |||||||
| Progressive Conservative gain from Liberal | Swing | +8.02 | ||||||
| Source: Elections Nova Scotia[3] | ||||||||
2017 general election
| 2017 provincial election redistributed results[4] | |||
|---|---|---|---|
| Party | Vote | % | |
| Liberal | 3,120 | 39.48 | |
| Progressive Conservative | 2,443 | 30.91 | |
| New Democratic | 2,339 | 29.60 | |
| Green | 1 | 0.01 | |
| 2017 Nova Scotia general election | ||||||||
|---|---|---|---|---|---|---|---|---|
| Party | Candidate | Votes | % | ±% | ||||
| Liberal | Suzanne Lohnes-Croft | 3,110 | 39.45 | +1.64 | ||||
| Progressive Conservative | Brian Pickings | 2,425 | 30.76 | +1.47 | ||||
| New Democratic | Marc Breaugh | 2,348 | 29.78 | -3.11 | ||||
| Total valid votes | 7,883 | 100.0 | ||||||
| Total rejected ballots | 67 | 0.84 | ||||||
| Turnout | 7,950 | 56.22 | ||||||
| Eligible voters | 14,140 | |||||||
| Liberal hold | Swing | +0.09 | ||||||
| Source: Elections Nova Scotia[5][6] | ||||||||
2013 general election
| Party | Candidate | Votes | % | ±% | |
|---|---|---|---|---|---|
| Liberal | Suzanne Lohnes-Croft | 3,182 | 37.81 | ||
| New Democratic Party | Pam Birdsall | 2,768 | 32.89 | ||
| Progressive Conservative | Brian Pickings | 2,465 | 29.29 | ||
2009 general election
| Party | Candidate | Votes | % | ±% | |
|---|---|---|---|---|---|
| New Democratic Party | Pam Birdsall | 3,644 | 48.82 | ||
| Progressive Conservative | Peter Zwicker | 2,049 | 27.45 | ||
| Liberal | Rick Welsford | 1,190 | 15.94 | ||
| Independent | Milton Countway | 457 | 6.12 | ||
| Green | Jason Remai | 124 | 1.66 | – | |
2006 general election
| Party | Candidate | Votes | % | ±% | |
|---|---|---|---|---|---|
| Progressive Conservative | Michael Baker | 3,969 | 48.67 | ||
| New Democratic Party | Chris Heide | 2,790 | 34.21 | ||
| Liberal | Rick Welsford | 1,200 | 14.71 | ||
| Green | Stuart Simpson | 196 | 2.40 | – | |
2003 general election
| Party | Candidate | Votes | % | ±% | |
|---|---|---|---|---|---|
| Progressive Conservative | Michael Baker | 3,734 | 46.36 | ||
| New Democratic Party | Chris Heide | 2,625 | 32.59 | ||
| Liberal | Jim Davis | 1,695 | 21.05 | ||
1999 general election
| Party | Candidate | Votes | % | ±% | |
|---|---|---|---|---|---|
| Progressive Conservative | Michael Baker | 4,590 | 51.48 | ||
| Liberal | Lila O'Connor | 2,344 | 26.29 | ||
| New Democratic Party | Marilyn Keddy | 1,982 | 22.23 | ||
1998 general election
| Party | Candidate | Votes | % | ±% | |
|---|---|---|---|---|---|
| Progressive Conservative | Michael Baker | 3,231 | 36.10 | ||
| Liberal | Lila O'Connor | 3,099 | 34.62 | ||
| New Democratic Party | Marilyn Crook | 2,621 | 29.28 | ||
1993 general election
| Party | Candidate | Votes | % | ±% | |
|---|---|---|---|---|---|
| Liberal | Lila O'Connor | 3,982 | 41.07 | ||
| Progressive Conservative | Al Mosher | 3,709 | 38.26 | ||
| New Democratic Party | Wade Garrison | 1,487 | 15.34 | ||
| } | Independent | Walton Cook | 517 | 5.33 | |
References
- Electoral History for Lunenburg Nova Scotia Legislature
- "Find Your Electoral District for the 41st Provincial General Election". enstools.electionsnovascotia.ca. Elections Nova Scotia. Retrieved 22 July 2021.
- "Provincial General Election 2021-08-17- Official Results". Elections Nova Scotia. Retrieved October 7, 2021.
- Transposition of Votes from the 2017 Provincial General Election to 2019 Electoral District Boundaries
- "Statement of Votes & Statistics, Volume I" (PDF). Elections Nova Scotia. Retrieved July 17, 2021.
- "May 30th, 2017 - 40th Nova Scotia Provincial General Election". Elections Nova Scotia. Retrieved July 17, 2021.
External links
This article is issued from Wikipedia. The text is licensed under Creative Commons - Attribution - Sharealike. Additional terms may apply for the media files.